filmov
tv
Creating a stacked barchart in R with ggplot2 (CC102)

Показать описание
A stacked barchart is a common approach to depicting relative abundance data in microbiome studies. How do you create stacked barplots in R with ggplot2? Shouild you even be creating stacked bar plots? Check out this episode of Code Club to learn how to create those iconic stacked bar charts and Pat will also tell you why they're problematic.
Do you have a figure that you would like to receive a critique or help improving? Let me know and I'd be happy to arrange a guest appearance!
You can also find complete tutorials for learning R with the tidyverse using...
0:00 Introduction
2:44 Aggregating relative abundances
7:58 Building stacked barchart
9:21 Improving appearance of labels
12:48 Improving appearance of legend
16:56 Critique of figure
21:00 Recap
 0:05:05
How To... Create a Stacked Chart in Excel 2010
 0:05:27
Excel Visualization | How To Combine Clustered and Stacked Bar Charts
 0:02:15
How to create a Clustered Stacked Column Chart in Excel
 0:01:00
Quickly create a Stacked Bar Chart in Excel
 0:06:17
How to Make STACKED Bar Charts in Excel (WK4c)
 0:05:01
How to Add Total Values to Stacked Chart in Excel
 0:11:05
Excel Column Chart - Stacked and Clustered combination graph
 0:08:09
Clustered Stacked Bar Chart In Excel
 0:00:36
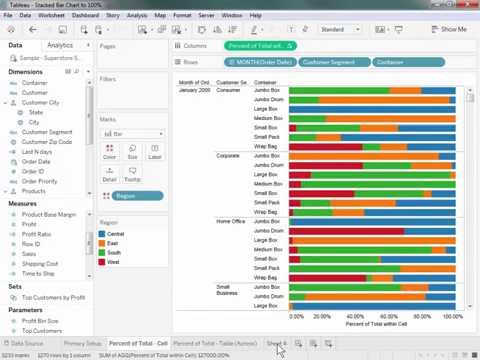
How to create a Stacked Side-by-side Bar Charts in Tableau
 0:09:24
019. How to create a Clustered Stacked Column Chart in Excel
 0:03:28
Make a Clustered Stacked Chart in Excel
 0:02:42
How to Create a Stacked Bar Chart Using Multiple Measures in Tableau
 0:01:00
Add totals to a vertical stacked bar chart #excel
 0:22:19
Creating a stacked barchart in R with ggplot2 (CC102)
 0:10:03
Create a Stacked Bar Chart in Microsoft POWER BI - DATA VIZ SERIES by Rahim Zulfiqar Ali
 0:01:14
How to create a Dual Axis & Stacked Grouped Bar Charts in Tableau
 0:04:32
How to Create a Stacked Bar Chart in Excel: Step-by-Step Guide
 0:03:13
How to Create A Stacked Column Chart in Google Sheets (2021)
 0:02:20
How to make a Stacked Bar Chart on Graphpad Prism #stacked #graphp #graphpad #tutorial #science
 0:03:18
Combine stacked and clustered bar chart in Excel
 0:02:12
Creating a stacked and grouped bar chart - Qlik Sense
 0:07:53
Tableau - Bar Chart & Stacked Chart
 0:02:45
How to Create a Stacked Bar Chart That Adds up to 100% in Tableau
 0:10:58
How to Create a Stacked Bar or Column Chart in Excel
Комментарии