filmov
tv
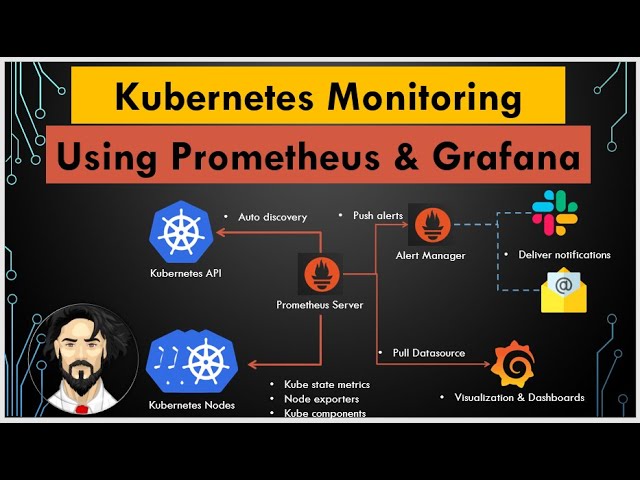
Setup Prometheus & Grafana Monitoring On Kubernetes Using Helm
Показать описание
#prometheusmonitoring #kubernetes #devops
In this video we are going to learn how to setup Monitoring Kubernetes with Prometheus & Grafana.
----------------------------------------------------------------------------------
Timestamp
-----------------------------------------------------------------------------------
0:00 - Intro
0:57 - Agenda
2:01 - What is Prometheus
3:14 - What is Grafana
4:31 - Prometheus Architecture
8:03 - Different ways to setup Promethus & Grafana on Kubernetes
11:09 - Prometheus and Grafana playlist
12:39 - Hands On setup of Prometheus and Grafana
--------------------------------------------------------------------------------
-------------------------------------------------------------------------------
-------------------------------------------------------------------------------
------------------------------------------------------------------------------
Steps for Helm Installation:
----------------------------------------------------------------------------
=======================================
Follow me @:
=======================================
 0:24:36
Server Monitoring // Prometheus and Grafana Tutorial
 0:13:51
Creating Grafana Dashboards for Prometheus | Grafana Setup & Simple Dashboard (Chart, Gauge, Tab...
 0:21:23
Monitoring with Prometheus and Grafana for beginners | Learn how to install and configure Prometheus
 0:32:12
Setup Prometheus & Grafana Monitoring On Kubernetes Using Helm
 0:32:12
Effortless Server Monitoring: Install Grafana, Prometheus & Node Exporter with Docker!
 0:25:42
Setup Prometheus Monitoring on Kubernetes using Helm and Prometheus Operator | Part 1
 0:21:31
How Prometheus Monitoring works | Prometheus Architecture explained
 0:36:42
Getting started with Prometheus Grafana and Node exporter - Part 1
 0:27:41
Beautiful Dashboards with Grafana and Prometheus - Monitoring Kubernetes Tutorial
 0:25:27
🔥 Server Monitoring with Prometheus and Grafana Tutorial
 0:08:15
Monitor Linux Server Performance with Prometheus and Grafana on Ubuntu Server
 0:03:40
Setting Up Prometheus And Grafana on AKS (Getting Started)
 0:17:19
How To Setup Prometheus Datasource In Grafana Tutorial | Prometheus Integration With Grafana
 0:17:56
How to Install Prometheus and Grafana on Ubuntu? (Node Exporter & Alertmanager & Pushgateway...
 0:45:39
Monitoring Microservice using Prometheus and Grafana - Part 1 | Setup Grafana Dashboard
 0:17:10
7:Install Prometheus and Grafana on Windows -WMI Exporter|Monitoring Windows Server with Prometheus
 0:22:24
How To Install Prometheus And Grafana On Docker
 0:23:57
Best Server Monitoring with Prometheus and Grafana using Node Exporter and cAdvisor
 0:08:47
Monitor Mikrotik Router with Prometheus and Grafana on Ubuntu Server
 1:09:32
Prometheus Tutorial | Monitoring with Prometheus And Grafana | Prometheus Grafana Tutorial | Edureka
 0:26:29
Monitoring Java Applications with Prometheus and Grafana
 0:26:03
Grafana Dashboard📊: Monitor CPU, Memory, Disk and Network Traffic Using Prometheus and Node Exporter...
 0:20:16
Prometheus + Node Exporter + Grafana // Anleitung Teil 1 // Performance Monitoring
 0:31:48
Project 5: Setup Monitoring and Alerting on Kubernetes | Prometheus and Grafana Tutorial
Комментарии