filmov
tv
Monitor Linux Server Performance with Prometheus and Grafana on Ubuntu Server

Показать описание
Prometheus systemd file
=======================
[Unit]
Description=Prometheus
[Service]
Restart=always
[Install]
Node exporter systemd file
============================
[Unit]
Description=Node Exporter
[Service]
ExecStart=/etc/node_exporter/node_exporter
Restart=always
[Install]
Prometheus scrape file
==========================
global:
scrape_interval: 15s
scrape_configs:
- job_name: node
static_configs:
- targets: ['localhost:9100']
 0:08:15
Monitor Linux Server Performance with Prometheus and Grafana on Ubuntu Server
 0:17:59
Linux Server Monitoring with SAR & GNUPLOT | Monitor Linux Server Performance | RH442 Training
 0:10:51
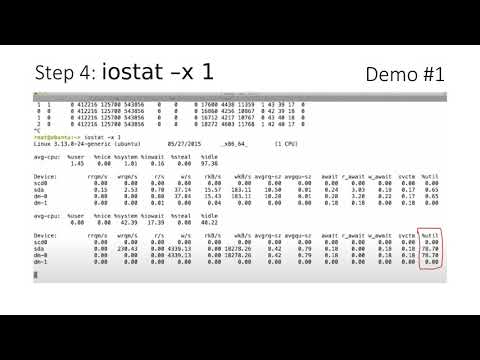
Linux Performance Troubleshooting Demos
 0:05:23
How to Monitor Real-Time Network Traffic in a Linux Server | VNSTAT | Linux bandwidth monitoring
 0:17:33
Netdata - A Free (and Powerful) Monitoring Solution for your Linux Servers (Full Review)
 0:11:02
Monitor Linux Servers with Zabbix - Comprehensive Setup Guide
 0:46:49
Monitoring SQL Server on Linux performance with Performance Co-Pilot and Grafana By Louis Imershein
 0:05:47
Monitor Linux server performance using Glances tools
 0:08:29
Monitor Your Server Performance: Install Btop on Portainer
 0:26:31
How to Monitor Linux system Performance Using Sar| Troubleshoot server performance issue with sar
 0:19:09
Linux Server Monitoring Commands | Linux Server Performance Monitoring using 4 commands
 0:07:14
Troubleshooting IO performance issues on Linux
 0:06:32
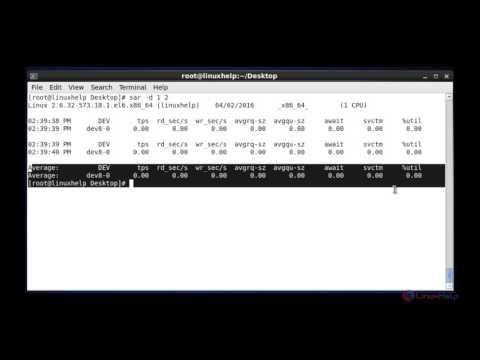
How to Monitor Linux system Performance Using Sar Tool
 0:01:13
Linux Performance Analysis in 60 seconds
 0:24:36
Server Monitoring // Prometheus and Grafana Tutorial
 0:04:25
Linux Server Performance Monitoring With nmon Tool
 0:01:22
Monitor Your Linux Environment with SAM
 0:29:01
BEST Home Server Monitoring Setup! (Linux, Proxmox, Unraid, and more)
 0:09:29
Create a Linux Service Monitoring Script - Learn Bash scripting tutorial
 0:10:04
Episode 19: Monitor Linux & Unix Servers’ performance using NMON
 0:15:36
Linux Server Monitoring | server troubleshooting command must know everyone | analyze performance
 0:04:17
How to Remotely Scan Windows & Linux Computer Performance | Monitor Server Resource Usage
 0:54:29
Linux Performance Tools, Brendan Gregg, part 1 of 2
 0:01:15
Monitor Linux Server Performance Using Vector on ubuntu 17 zesty zapus
Комментарии