filmov
tv
Grafana Dashboard📊: Monitor CPU, Memory, Disk and Network Traffic Using Prometheus and Node Exporter

Показать описание
In this video I show you how to a build a Grafana dashboard from scratch that will monitor a virtual machine's CPU utilization, Memory Usage, Disk Usage, and Network Traffic using the Node-Exporter data collector and Prometheus as the Data Source
USED DISK SPACE QUERY: node_filesystem_size_bytes{job="jenkins-node",instance="localhost:9100",device!~"/dev/loop.*", device!~"tmpfs|nsfs", device!="gvfsd-fuse"} - node_filesystem_avail_bytes{job="jenkins-node",instance="localhost:9100"}
AVAILABLE DISK SPACE QUERY: node_filesystem_avail_bytes{job="jenkins-node",instance="localhost:9100",device!~"/dev/loop.*",device!~"tmpfs|nsfs",device!="gvfsd-fuse"}
TOC:
Introduction: 00:00 - 1:44
CPU metric: 1:45 - 09:03
Memory Usage: 09:04 - 14:15
Disk Usage: 14:16 - 21:20
Network Traffic: 21:21 - 25:06
Conclusion: 25:07 - 26:02
 0:26:03
Grafana Dashboard📊: Monitor CPU, Memory, Disk and Network Traffic Using Prometheus and Node Exporter...
 0:25:57
How to monitor Containers in Kubernetes using Prometheus & cAdvisor & Grafana? CPU, Memory, ...
 0:24:36
Server Monitoring // Prometheus and Grafana Tutorial
 0:26:51
How to Install and Configure Grafana: Setup Dashboard to Monitor CPU, Memory, Disk, and Network
 0:04:32
Grafana Explained in Under 5 Minutes ⏲
 0:23:57
Best Server Monitoring with Prometheus and Grafana using Node Exporter and cAdvisor
 0:19:20
Prometheus Node Exporter Tutorial | Monitor CPU, Memory, Disk etc.
 0:16:02
How to Setup a Grafana Dashboard Step-by-Step | Grafana Tutorial for Beginners
 0:27:41
Beautiful Dashboards with Grafana and Prometheus - Monitoring Kubernetes Tutorial
 0:08:15
Monitor Linux Server Performance with Prometheus and Grafana on Ubuntu Server
 0:13:51
Creating Grafana Dashboards for Prometheus | Grafana Setup & Simple Dashboard (Chart, Gauge, Tab...
 0:14:50
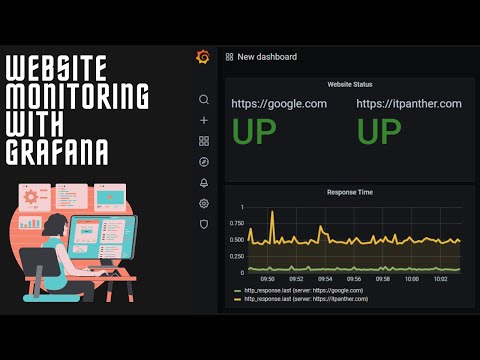
Monitor Websites With #Grafana InfluxDb and Telegraf - Synthetic Monitoring Using Grafana & Tele...
 0:27:21
Using MySQL to Create a Grafana Dashboard
 0:21:09
Analyzing Performance of Open Stack with Grafana Dashboards
 0:03:47
How to create an alert in Grafana
 0:25:27
🔥 Server Monitoring with Prometheus and Grafana Tutorial
 0:21:12
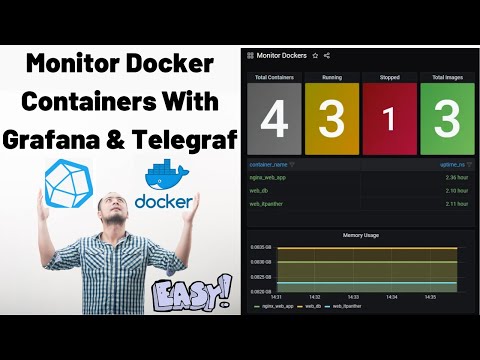
Monitoring #Docker Using #Grafana | Monitor Docker Containers with Grafana
 0:10:11
01 - SQLMonitor - Dashboard - Monitoring All Servers
 0:09:53
Dashboards for DAYS! - How we use Grafana in our #homelab!
 0:06:49
Prometheus Tutorial | Create Beautiful Prometheus Dashboards in Grafana in 5 Minutes
 0:03:17
Effective troubleshooting with Grafana Loki - query basics
 0:06:38
Embedding Grafana Dashboard in Iframe HTML or Website
 0:25:05
Docker Monitoring using cAdvisor Prometheus & Grafana
 0:18:23
Spring Boot - Monitoring Microservice with Prometheus and Grafana | Java Techie
Комментарии