filmov
tv
🔥 Server Monitoring with Prometheus and Grafana Tutorial

Показать описание
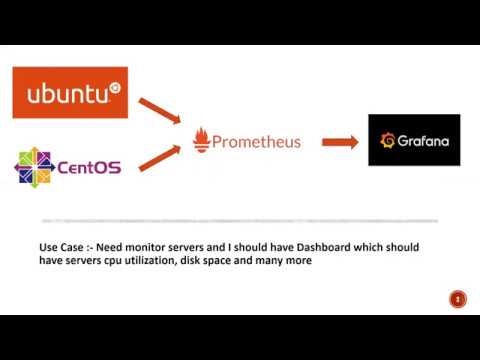
In this video, I will show you how to monitor your servers with Grafana and Prometheus.
Grafana is a multi-platform open-source interactive visualization web application. It provides you with charts, graphs, and alerts, while getting server monitoring with Prometheus.
Enjoy the video!
⏰Timestamps⏰
00:00 Intro
00:28 Download Prometheus
02:08 Download Grafana
03:48 NSSM Download
04:49 Configuration and Installation of Grafana, Prometheus and NSSM
10:21 Metrics in Prometheus
12:06 Open Localhost
13:37 Import Data Source in Grafana
15:18 Explore Dashboards
16:44 Outro
⬇️ Download Prometheus ⬇️
⬇️ Download Grafana ⬇️
Be sure to leave any questions or comments below!
See More Videos and Subscribe
 0:24:36
Server Monitoring // Prometheus and Grafana Tutorial
 0:25:27
🔥 Server Monitoring with Prometheus and Grafana Tutorial
 0:23:57
Best Server Monitoring with Prometheus and Grafana using Node Exporter and cAdvisor
 0:21:31
How Prometheus Monitoring works | Prometheus Architecture explained
 0:08:15
Monitor Linux Server Performance with Prometheus and Grafana on Ubuntu Server
 0:32:12
Effortless Server Monitoring: Install Grafana, Prometheus & Node Exporter with Docker!
 0:10:38
Introduction to the Prometheus Monitoring System | Key Concepts and Features
 1:09:32
Prometheus Tutorial | Monitoring with Prometheus And Grafana | Prometheus Grafana Tutorial | Edureka
 0:23:41
Based on Past Interview Experiences: Spring Boot Interview Questions and Answers 2024 | Scenario Q&a...
 0:51:44
Server Monitoring with Grafana Prometheus and Loki
 0:11:01
Prometheus for Server Monitoring | Grafana Tutorial on Windows | Prometheus Windows Exporter
 0:20:16
Prometheus + Node Exporter + Grafana // Anleitung Teil 1 // Performance Monitoring
 0:33:27
TUTORIAL Monitoring Server Menggunakan Grafana dan Prometheus
 0:10:21
Monitoring Linux Host Metrics with Prometheus | Node Exporter (Setup, Scrape, Query, Grafana)
 0:31:59
Setting up Prometheus and Grafana for monitoring your servers
 0:10:43
Don't Make These 6 Prometheus Monitoring Mistakes | Prometheus Best Practices & Pitfalls
 0:06:21
Prometheus Architecture | How DevOps monitoring using Prometheus works
 0:21:23
Monitoring with Prometheus and Grafana for beginners | Learn how to install and configure Prometheus
 0:31:05
How To Monitor Your Go App With Prometheus
 0:08:08
Getting Started with Prometheus | Minimal Setup (Download, Config & Run)
 0:16:30
How to Monitor Nginx with Prometheus and Grafana? (Step-by-Step - Install - Monitor - Fluentd)
 0:16:16
Server Monitoring OpenTelemetry Prometheus and Grafana on Windows
 0:00:37
How Prometheus and Grafana works? #devops #monitoring
 0:29:56
Install Prometheus and Grafana with WMI Exporter on Window Server 2022 EC2|Windows Server Monitoring
Комментарии