filmov
tv
Beautiful Dashboards with Grafana and Prometheus - Monitoring Kubernetes Tutorial

Показать описание
Grafana and Prometheus are a powerful monitoring solution. It allows you to visualize, query, and alert metrics no matter where they are stored. Today, we'll install and configure Prometheus and Grafana in Kubernetes using kube-prometheus-stack. By the end of this tutorial you be able to observe and visualize your entire Kubernetes cluster with Grafana and Prometheus.
A HUGE thanks to Datree for sponsoring this video!
Combat misconfigurations. Empower engineers.
(Affiliate links may be included in this description. I may receive a small commission at no cost to you.)
00:00 - What is Prometheus and Grafana
01:52 - Ad: Datree - Prevent Kubernetes Misconfigurations
03:05 - Prometheus Requirements
05:41 - Create a Namspace
06:22 - Installing with Helm and Using Values
09:12 - Alert Manager Helm Values
10:34 - Grafana Helm Values
11:30 - Helm Values for k3s Server
12:30 - Overriding and Relabeling with Helm
13:18 - Storage Class with Helm
15:22 - Creating Kubernetes Secrets for Grafana
17:30 - Installing Prometheus Stack
19:16 - Port Forwarding to Grafana with Kubernetes
20:58 - Exploring Charts in Grafana
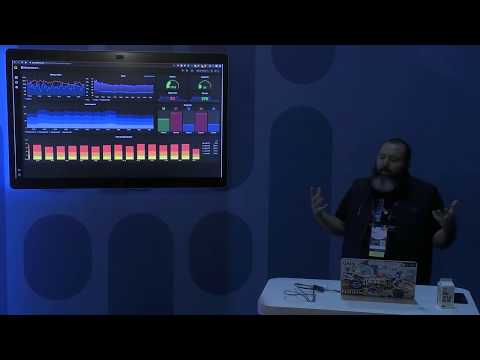
23:37 - My Home Production Cluster Metrics
26:58 - Stream Highlight: "Chat tries to get me to speak German"
#grafana #prometheus #kubernetes
Thank you for watching!
A HUGE thanks to Datree for sponsoring this video!
Combat misconfigurations. Empower engineers.
(Affiliate links may be included in this description. I may receive a small commission at no cost to you.)
00:00 - What is Prometheus and Grafana
01:52 - Ad: Datree - Prevent Kubernetes Misconfigurations
03:05 - Prometheus Requirements
05:41 - Create a Namspace
06:22 - Installing with Helm and Using Values
09:12 - Alert Manager Helm Values
10:34 - Grafana Helm Values
11:30 - Helm Values for k3s Server
12:30 - Overriding and Relabeling with Helm
13:18 - Storage Class with Helm
15:22 - Creating Kubernetes Secrets for Grafana
17:30 - Installing Prometheus Stack
19:16 - Port Forwarding to Grafana with Kubernetes
20:58 - Exploring Charts in Grafana
23:37 - My Home Production Cluster Metrics
26:58 - Stream Highlight: "Chat tries to get me to speak German"
#grafana #prometheus #kubernetes
Thank you for watching!
 0:27:41
Beautiful Dashboards with Grafana and Prometheus - Monitoring Kubernetes Tutorial
 0:01:05
Grafana 10.1: How to build dashboards with visualizations and widgets
 0:20:07
Create beautiful dashboards with Grafana.
 0:56:51
Building Beautiful Interactive Dashboards with Grafana and ClickHouse | ClickHouse Webinar
 0:13:36
Microsoft Azure Dashboard in Grafana - Tutorial
 0:13:51
Creating Grafana Dashboards for Prometheus | Grafana Setup & Simple Dashboard (Chart, Gauge, Tab...
 0:04:32
Grafana Explained in Under 5 Minutes ⏲
 0:04:59
Building a custom Grafana dashboard for Kubernetes observability
 0:22:24
Grafana Dashboard Tutorial | How to Setup a Grafana Dashboard Step-by-Step | Grafana Tutorial
 0:16:34
6 Easy Ways to Improve your Log Dashboards with Grafana and Loki
 0:16:02
How to Setup a Grafana Dashboard Step-by-Step | Grafana Tutorial for Beginners
 0:05:08
How to collect vSphere metrics and create grafana dashboards
 0:36:24
Business Dashboards with Grafana and MySQL
 0:09:53
Dashboards for DAYS! - How we use Grafana in our #homelab!
 0:21:09
Analyzing Performance of Open Stack with Grafana Dashboards
 0:08:42
How to create Grafana Dashboards: The Easy way
 0:14:44
Create your Business Grafana dashboard | Step by step for analysts | Grafana Tutorial
 0:13:54
Lesson 17 - Creating Dynamic Grafana Dashboards using Variables in Grafana
 0:10:28
Grafana Dashboard with Log Analytics Data
 0:21:00
How To Setup A Grafana Dashboard Step By Step
 0:11:32
Monitor Website Health with Grafana | Website Health, Ping, DNS responses beautiful realtime graphs
 0:01:25
How to create a new dashboard in Grafana
 0:06:49
Prometheus Tutorial | Create Beautiful Prometheus Dashboards in Grafana in 5 Minutes
 0:18:21
Automating Grafana Dashboards with Jsonnet
Комментарии