filmov
tv
Excel Magic Trick 1420: Ranking in Power Query: Sort, Grouping, Indexes and Custom Columns
Показать описание
Download File:
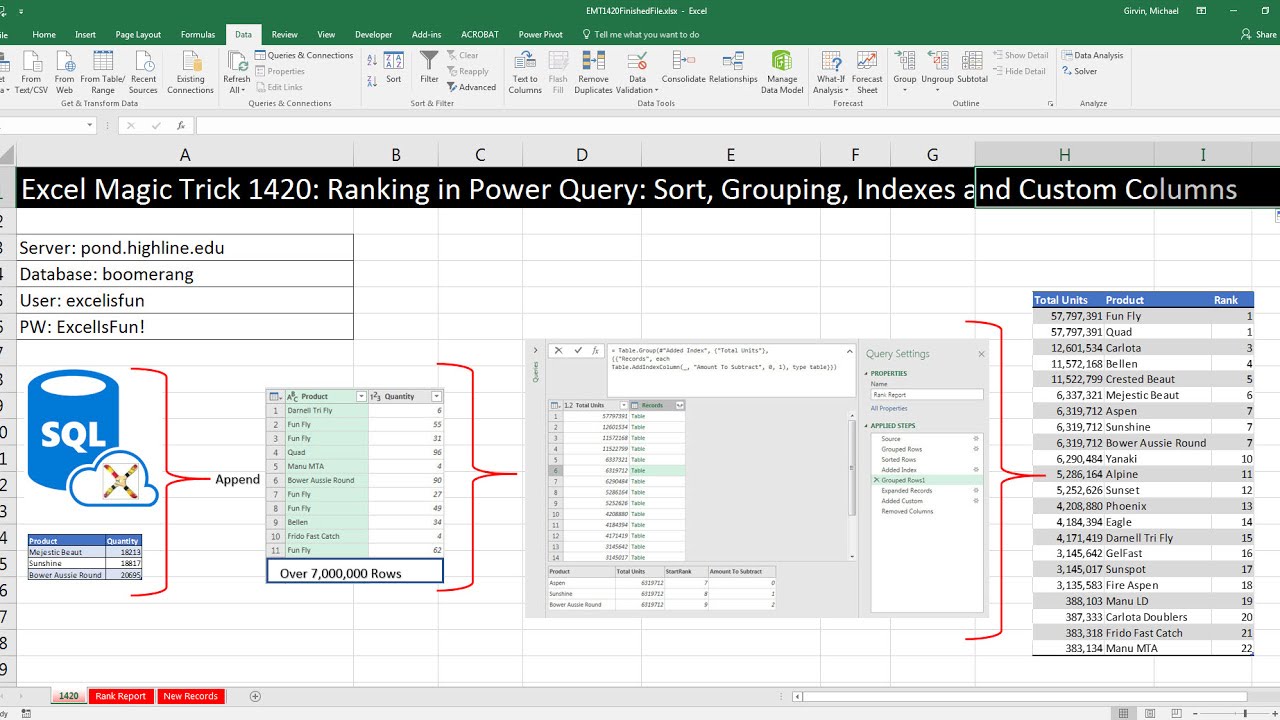
See how to connect to an SQL Database, Append an Excel Table to the SQL Imported Data, Group By to add Total Units for each Product, then Sort, Grouping, Indexes and Custom Columns to Rank Total Product Units:
1. (00:14) Introduction of whole project
2. (01:29) Connect to an SQL Database that contains over 7 million records
3. (02:47) Import Excel Table
4. (03:25) Append an Excel Table to the SQL Imported Data
5. (04:06) Group By feature to add Total Units for each Product
6. (05:01) Sort, Grouping, Indexes and Custom Columns to Rank Total Product Units
7. (11:54) Change Data and Refresh
8. (12:30) Summary
Related Videos:
Excel Magic Trick 1417: Excel Functions Ranking For Unit & Total Profit for Products within Manufacturer
Excel Magic Trick 1418: PivotTables Ranking For Unit & Total Profit for Products within Manufacturer
Excel Magic Trick 1419: RANKX DAX Function & More: Ranking Profit for Products within Manufacturer
Excel Magic Trick 1420: Ranking in Power Query: Sort, Grouping, Indexes and Custom Columns
 0:00:55
Power Query - Solving rank ties - reaction on Excel Magic Trick 1420
 0:12:51
Excel Magic Trick 1420: Ranking in Power Query: Sort, Grouping, Indexes and Custom Columns
 0:12:10
Excel Magic Trick 1417 Excel Functions Ranking Unit & Total Profit for Products within Manufactu...
 0:14:28
Excel Magic Trick 1418: PivotTables Ranking For Unit & Total Profit for Products within Manufact...
 0:05:41
Excel Magic Trick 1429: Power Query Ranking with Index, Grouping and MIN Function!!!
 0:27:06
Excel Magic Trick 1419: RANKX DAX Function & More: Ranking Profit for Products within Manufactur...
 0:27:23
Excel Magic Trick 1446: Power Query Count & Extract Customer Names for 8 Sales Coupon Groups
 0:18:09
Excel Magic Trick 1445: Single Cell Array Formula: Count Customer Names for 8 Sales Coupon Groups
 0:02:22
Excel Magic Trick 1421: Get Help for Power Query Functions
 0:10:20
Excel Magic Trick 1450: Replace VLOOKUP When Making PivotTables with Excel 2016 Relationships
 0:08:56
Excel Magic Trick 1489: 2 VLOOKUP in 1 Formula: Lookup Correct Volume Discount Product Price
 0:04:33
Excel Magic Trick 1422: Power Query M Code: Join all Items From Invoice into One Cell
 0:09:30
Power Query - Group Suppliers, Join with Line Feed From Multiple Text Files - Excel Magic Trick 1580
 0:15:43
Excel Magic Trick 1448: Conditional Formatting Formulas: Cell References To “Jump” To Next Template...
 0:13:46
Excel Magic Trick 1453 Array Formula Count Customer Totals Between Upper Lower Limits, Each Month
 0:06:07
Excel Magic Trick 1414: Power Query Text.PadStart Function to Correctly Format Account Numbers
 0:12:14
Excel Magic Trick 1427: DAX GEOMEANX function: Average Compounding Rate per Period for FV Calc
 0:07:09
Excel Magic Trick 1459: Adding Food or Accessory Costs For Each Dog with SUMIFS & SUMPRODUCT
 0:04:41
Excel Magic Trick 1404: Sales Per Working Day by Month using Power Query
 0:12:23
Excel Magic Trick 1137: Excel & PowerPivot DAX Formula: Approximate Match Lookup Without VLOOKUP
 0:10:31
Excel Magic Trick 1339: Create Alphabet A – Z: Formula, Power Query, or Custom List?
 0:05:15
Excel Magic Trick 1256: Grouped Dates in PivotTable With Becomes UnGrouped When I Refresh!!!
 0:01:13
2 Comments on Excel Magic Trick 1381
 0:09:24
How to Dynamically Rank with Ties in Power Query
Комментарии