filmov
tv
Excel Magic Trick 1387: Data Model & DAX Formulas: Quantity Frequency Distribution by Year & Country

Показать описание
Download Files:
See how to Create a Data Model with DAX Formula to build PivotTable Frequency Distribution with Conditional Formatting. Also learn how the Data Model and DAX Formulas work on Big Data:
1. (00:13) Introduction
2. (03:42) Build CountCategory Table in Excel. Learn about Table Formula Nomenclature in Excel Table.
3. (07:50) Build DAX Measure in Measure Grid to Calculate MAX Quantity
4. (09:36) Import CountCategory Table into Data Model
5. (10:05) Create Automatic dCalendar Table in Power Pivot
6. (11:14) Build Relationships Between Tables. Discussion “Filter Context” and of how Criteria from PivotTable filters Lookup Tables and how the “filter” flows across the Relationship to “filter the Fact table down to a smaller size, which helps DAX formulas to calculate quickly on Big Data.
7. (13:41) Build DAX Calculated Column in Fact Table to use in Relationship to CountCategory Table. Discussion of Columnar Database and how columns with a small number of unique values do not take up much RAM memory. See the CEILING DAX Function.
8. (18:01) Build PivotTable based on Data Model
9. (18:22) Sort Count Category Column by Upper Value Column so categories sort correctly in PivotTable
10. (20:04) Build DAX Measure Frequency Formula to count # transactions with specified quantity. Description of How Data Model and DAX Formulas calculate when criteria is applied in a PivotTable. See the COUNTROWS function.
11. (23:11) Finish Building PivotTable.
12. (23:51) Add Slicer to PivotTable
13. (24:58) Add Conditional Formatting to PivotTable
14. (26:03) Add Formatting to Dashboard
15. (27:48) Summary
 0:28:32
Excel Magic Trick 1387: Data Model & DAX Formulas: Quantity Frequency Distribution by Year &...
 0:06:15
Excel Magic Trick 1386: Power Query to Import & Append Large Text File in Power Pivot Data Model
 0:12:03
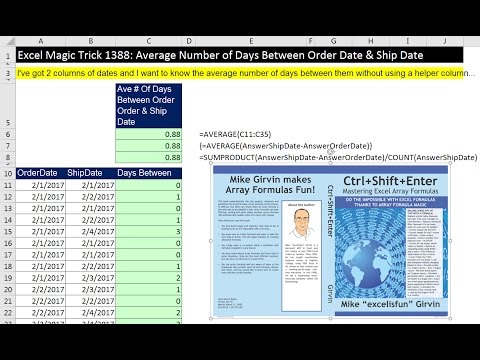
Excel Magic Trick 1388 Average Number of Days Between Order & Ship Date (Basic Array Formula Les...
 0:12:46
Excel Magic Trick 1407: Data Model & DAX Measures for Monthly Totals Report From Two Fact Tables
 0:04:00
Excel Magic Trick 1384: Import Excel Table or Sheet in Power Query or Power BI?
 0:02:42
Excel Magic Trick 1389: Average Number of Days Between Two Columns of Dates
 0:55:04
Excel Magic Trick 1375 Add w OR Logical Test from 2 Different Columns in 2 Diff. Tables (6 Examples)
 0:10:51
Excel Magic Trick 1400: Conditionally Format Row in Class Enrollment Table with Complex Criteria
 0:19:34
Excel Magic Trick 1400 Part 2: Conditionally Format Row with Complex Criteria (3 More Examples)
 0:12:47
Excel Magic Trick 1397 Part 3: % Cumulative Frequency Formula & X Y Chart for Irregular Incremen...
 0:11:22
Excel Magic Trick 1403: DAX Formulas: Explicit or Implicit Measures? Why Explicit is Better.
 0:03:56
Excel Magic Trick 1392: Case Sensitive Unique Count: Power Query or Data Model PivotTable?
 0:14:35
Excel Magic Trick 1391: Case Sensitive VLOOKUP? 5 Examples of Excel Case Sensitive Lookup
 0:41:14
Excel Magic Trick 1398: DAX Formulas for Running Total and % of Running Total & other DAX Tricks
 0:18:24
Excel Magic Trick 1372: Extract Only Total Row For Each Name: Formula or Power Query (6 Examples)
 0:22:36
Excel Magic Trick 1449: DAX Measure % Change MOM & YOY Formulas For Incomplete Years
 0:18:43
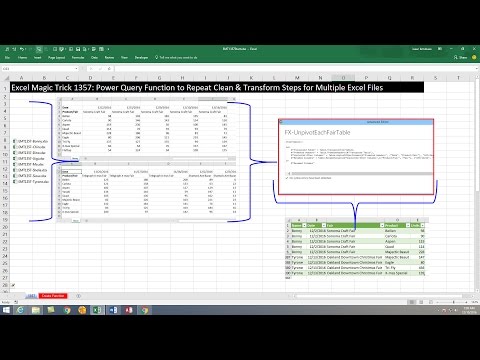
Excel Magic Trick 1357: Power Query Function to Repeat Clean & Transform Steps for Many Excel Fi...
 0:34:41
Excel Magic Trick 1395: DAX Measures for Show Values As % of Grand Total, Column Total, Parent Total
 0:10:30
Excel Magic Trick 1454 DAX Measure Count Customer Totals Between Upper Lower Limits, Each Month
 0:05:46
Excel Magic Trick 1385: Import Tables from SQL Server Database into Power Pivot or PBI Data Model
 0:14:10
Excel Magic Trick 1383: Conditional Format Row w OR Logical Test with Multiple Partial Text Criteria
 0:06:48
M Query Functions Basics
 0:35:56
Excel Magic Trick 1451: Hack Data Model, Date Table & DAX Measures WITHOUT buying Power Pivot
 0:00:13
#128 | MEDIAN Formula in Ms Excel | #msexcel #forbeginners
Комментарии