filmov
tv
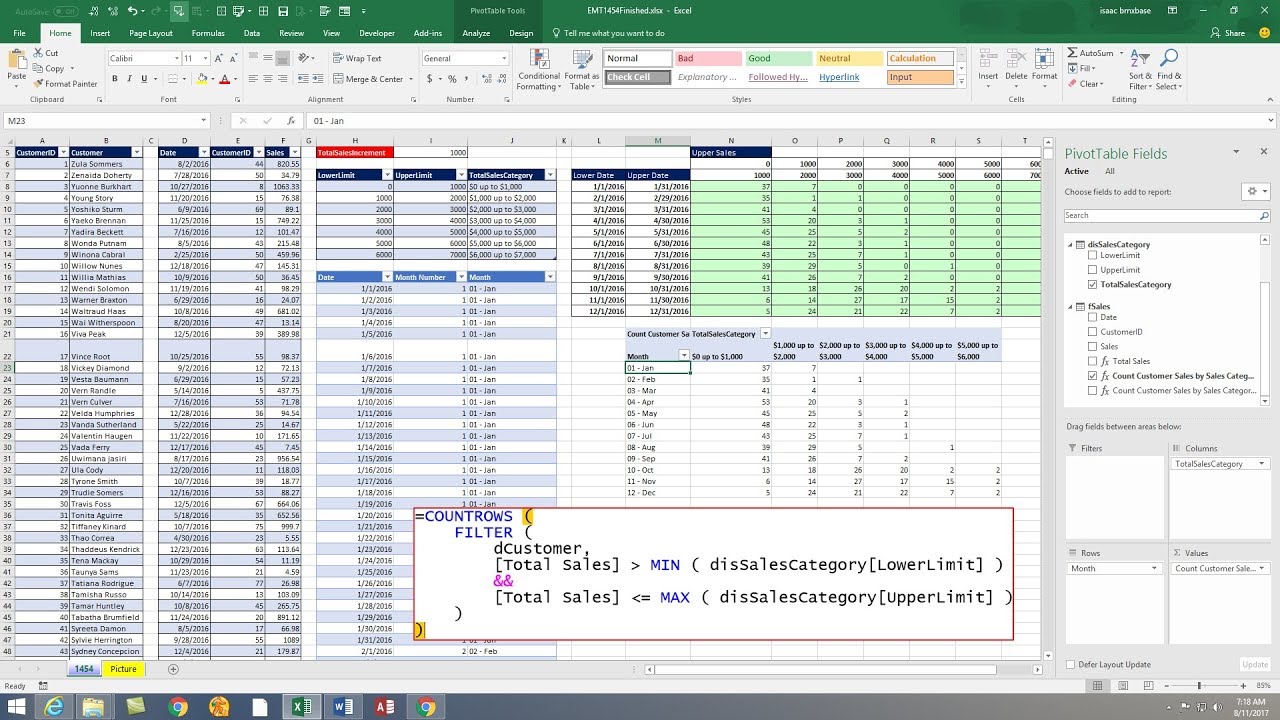
Excel Magic Trick 1454 DAX Measure Count Customer Totals Between Upper Lower Limits, Each Month
Показать описание
Count Customer Totals Between Upper & Lower Limits For Each Month using a DAX Measure in either Power Pivot or Power BI Desktop. See the DAX Functions: COUNTROWS, FILTER, MAX and MIN and an AND Logical Test. Create a Cross Tabulated Frequency Distribution that shows a count of Customer Totals for each month and each Sales Category.
Download File:
Related Videos:
Excel Magic Trick 1453 Array Formula Count Customer Totals Between Upper Lower Limits, Each Month
Excel Magic Trick 1454 DAX Measure Count Customer Totals Between Upper Lower Limits, Each Month
Download File:
Related Videos:
Excel Magic Trick 1453 Array Formula Count Customer Totals Between Upper Lower Limits, Each Month
Excel Magic Trick 1454 DAX Measure Count Customer Totals Between Upper Lower Limits, Each Month
 0:10:30
Excel Magic Trick 1454 DAX Measure Count Customer Totals Between Upper Lower Limits, Each Month
 0:13:46
Excel Magic Trick 1453 Array Formula Count Customer Totals Between Upper Lower Limits, Each Month
 0:16:16
Excel Magic Trick 1440: OR Logical Test on 2 Columns using DAX IN Operator & DAX OR Function
 0:06:52
Excel Magic Trick 1439: DAX Measures to Create Cross Tabulated OR & AND Logical Test Sales Total
 0:14:01
Excel Magic Trick 1408: DAX Measure: Moving 12 Month Average on Daily Sales (DAX Formatter too)
 0:09:29
Power Query - EMT 1453 to 1454 - Count Customer Totals Between Upper Lower Limits, Each Month
 0:08:00
Excel Magic Trick 1437: DAX Query OR Logical Test IN Operator: Pull Sales Team Data to Excel Sheet
 0:12:12
Excel Magic Trick 1434: SAMPLE DAX Function to Take Random Stratified Sample from Data Set.
 0:10:35
Excel Magic Trick 1455: Convert Text Month Criteria to Upper & Lower Dates for SUMIFS Function
 0:21:12
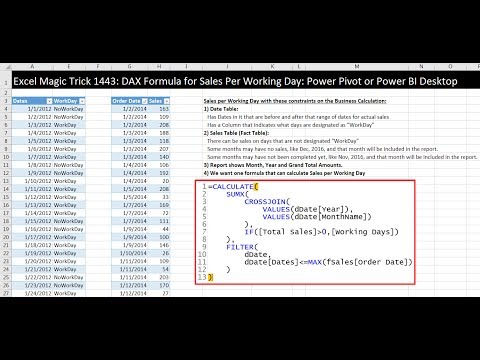
Excel Magic Trick 1443: DAX Formula for Sales Per Working Day: Power Pivot or Power BI Desktop
 0:22:36
Excel Magic Trick 1449: DAX Measure % Change MOM & YOY Formulas For Incomplete Years
 0:04:18
00164 Excel Magic Trick 1452 Max Monthly Customer
 0:35:56
Excel Magic Trick 1451: Hack Data Model, Date Table & DAX Measures WITHOUT buying Power Pivot
 0:06:20
Excel Magic Trick 1447: DAX DISTINCTCOUNT & CONCATENATEX to Count & List Stores Visited
 0:04:41
Excel Magic Trick 1404: Sales Per Working Day by Month using Power Query
 0:06:07
Excel Magic Trick 1438: Excel Formula to Create Cross Tabulated OR & AND Logical Test Sales Tota...
 0:20:38
Excel Magic Trick 1470: Power Query (Get & Transform) Add Daily Rainfall 5 AM to 5 AM Next Day
 0:10:59
Excel Magic Trick 1475: Power Query, Formula, Flash Fill: '1-PSD/AFX-12' into '12-AFX...
 0:27:23
Excel Magic Trick 1446: Power Query Count & Extract Customer Names for 8 Sales Coupon Groups
 0:18:09
Excel Magic Trick 1445: Single Cell Array Formula: Count Customer Names for 8 Sales Coupon Groups
 0:07:30
Excel Magic Trick 1152: Formula or Power Query: Cost Report When Product IDs Don’t Match
 0:19:53
Excel Magic Trick 1432: 9 DAX Formulas to Build Confidence Intervals CONFIDENCE.T, STDEV.S…
 0:37:16
Excel Magic Trick 1471: Array Formula: Add Daily Rainfall 5 AM to 5 AM Next Day: (Most Automatic)
 0:03:11
COUNTIFS in DAX for Power Pivot or Power BI? COUNTROWS Function. Excel Magic Trick 1550
Комментарии