filmov
tv
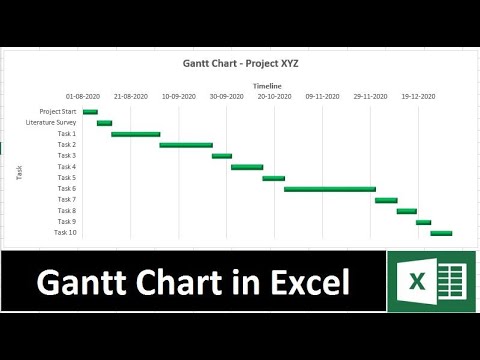
Easy Excel Gantt Charts - Perfect for Project Management

Показать описание
In this video I’m going to show you how easy it is to build Gantt charts in Excel using Conditional Formatting. We’ll also look at how we can highlight tasks that are overdue and the current date.
Note: the formula in column F should be: =IF(ISBLANK(B5),"",WORKDAY.INTL(B5-1,C5,1))
0:00 Excel Gantt Chart uses
0:22 Setting up for Gantt Charts in Excel
0:59 Calculating the Completion Date using WORKDAY.INTL
1:59 Gantt Chart Conditonal Formatting Rules
4:44 Highlight Overdue Tasks
6:19 Highlight the C urrent Date
7:08 Troubleshooting Conditional Formats
 0:08:29
Easy Excel Gantt Charts - Perfect for Project Management
 0:08:14
Gantt Chart Excel Tutorial - How to make a Basic Gantt Chart in Microsoft Excel
 0:15:59
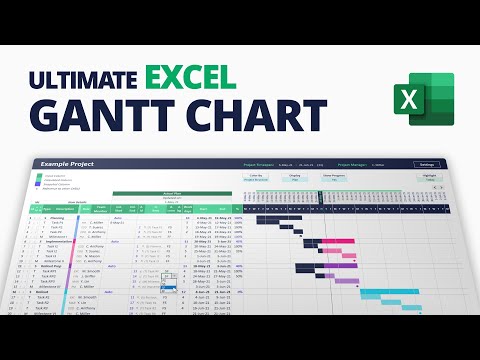
How to Make the BEST Gantt Chart in Excel (looks like Microsoft Project!)
 0:02:36
Gantt Chart Excel Tutorial - How to make a Basic Gantt Chart in Microsoft Excel 2016
 0:17:13
Make This Awesome Gantt Chart in Excel (for Project Management)
 0:05:29
Easy way to make Gantt Chart in Excel
 0:07:44
How to Make Gantt Chart in Excel
 0:00:12
Gantt Excel - Fastest Way to Create a Gantt Chart
 0:09:36
TECH-005 - Create a quick and simple Time Line (Gantt Chart) in Excel
 0:07:02
How to Make a Gantt Chart Using Excel [EASIEST GANTT CHART METHOD]
 0:06:37
How to create a Gantt Chart in Excel
 0:11:20
How to Quickly Make a Gantt Chart in Excel
 0:04:36
Gantt Chart in Excel Simple, Easy and Quick Method
 0:06:32
How to Make a Simple Gantt Chart in Excel | TeamGantt
 0:02:14
How To Make Gantt Chart In Excel - Full Guide
 0:04:46
Creating a Simplified GANTT CHART with AND Function + Conditional Formatting in Excel
 3:18:01
How to create Ultimate Excel Gantt Chart for Project Management (with Smart Dependency Engine)
 0:05:49
Excel Gantt Chart EASY 📈
 0:07:16
How To Create A Gantt Chart With A Progress Bar To Show Percentage Completion Of Tasks In Excel
 0:02:48
What is a Gantt chart? ...explained in under 3 minutes
 0:07:52
7 minutes trick to Bar Chart or Gantt Chart in Excel | Smart Project Management
 0:00:49
Easy Excel Gantt Chart Tutorial for Project Management - Step-by-Step Guide
 0:00:38
Create a Gantt Chart Excel #excel #exceltips
 0:01:00
Gantt Chart in Excel | 60 Seconds Tutorial #shorts
Комментарии