filmov
tv
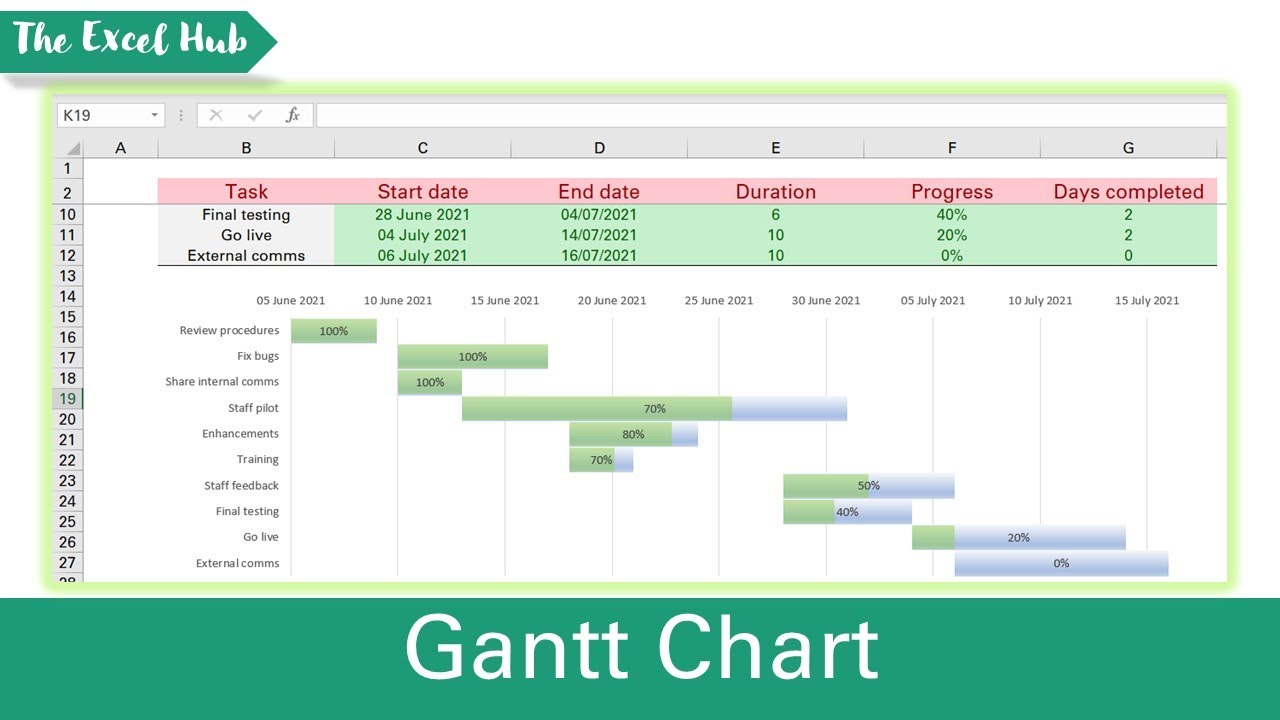
How To Create A Gantt Chart With A Progress Bar To Show Percentage Completion Of Tasks In Excel
Показать описание
A Gantt chart is a bar chart which is used to illustrate tasks that are to be completed over time in a project. To create our Gantt chart, the first step is to set up a project table with a list of tasks to be completed and their start and end dates. The next step is to calculate the duration of each task which is the end date minus the start date. Later on, we will use the start date and duration columns to create our Gantt chart. We can also include the progress towards achieving each task and use this to identify how many days of each task have been completed. To create our Gantt chart, we will insert a stacked bar chart. We will use error bars, data labels and other techniques to make the bar chart look like a Gantt chart which will give us a clear overview of the tasks that must be completed and how much progress has been made so far.
Subscribe for weekly Excel tutorials, techniques and examples:
Please share this video with others that may find it useful:
Please comment below if you have any feedback or any suggestions for videos you would like us to upload next!
ABOUT US:
The Excel Hub seeks to enhance your Excel and VBA knowledge by providing value-adding tutorials, techniques and examples in order to help you take your spreadsheet and data analysis skills to the next level.
For any enquiries, please contact:
Overview: (0:00)
Set Up Project Table: (0:23)
Create Gantt Chart: (1:32)
 0:07:44
How to Make Gantt Chart in Excel
 0:08:14
Gantt Chart Excel Tutorial - How to make a Basic Gantt Chart in Microsoft Excel
 0:15:59
How to Make the BEST Gantt Chart in Excel (looks like Microsoft Project!)
 0:06:37
How to create a Gantt Chart in Excel
 0:00:12
Gantt Excel - Fastest Way to Create a Gantt Chart
 0:02:36
Gantt Chart Excel Tutorial - How to make a Basic Gantt Chart in Microsoft Excel 2016
 0:10:02
How to Create a Gantt Chart in 9 Easy Steps
 0:17:13
Make This Awesome Gantt Chart in Excel (for Project Management)
 0:12:11
WBS Gantt-Chart for Jira - Get Started - Full demo - Product Overview
 0:10:41
How to Create a Gantt Chart in Google Sheets
 0:09:23
How to Create a Gantt Chart in Microsoft Project (Microsoft Project for Beginners)
 0:05:29
Easy way to make Gantt Chart in Excel
 0:11:20
How to Quickly Make a Gantt Chart in Excel
 0:07:16
How To Create A Gantt Chart With A Progress Bar To Show Percentage Completion Of Tasks In Excel
 0:03:56
How to Create a Basic Gantt Chart in Microsoft Project 2022
 0:09:36
TECH-005 - Create a quick and simple Time Line (Gantt Chart) in Excel
 0:07:02
How to Make a Gantt Chart Using Excel [EASIEST GANTT CHART METHOD]
 0:05:51
How To Create The BEST Gantt Chart In Excel 2024
 3:18:01
How to create Ultimate Excel Gantt Chart for Project Management (with Smart Dependency Engine)
 0:16:29
PROJECT MANAGEMENT in Power BI? Create a GANTT CHART from a bar chart | NO CUSTOM VISUAL solution
 0:08:28
How to Create a Gantt Chart in Excel in 10 Minutes! (FREE Download Included!)
 0:16:22
How to Make a Gantt Chart in Excel - Step by Step Tutorial - Gantt Chart Excel
 0:01:00
Gantt Chart in Excel | 60 Seconds Tutorial #shorts
 0:06:43
How to Create a Gantt Chart | TeamGantt Tips
Комментарии