filmov
tv
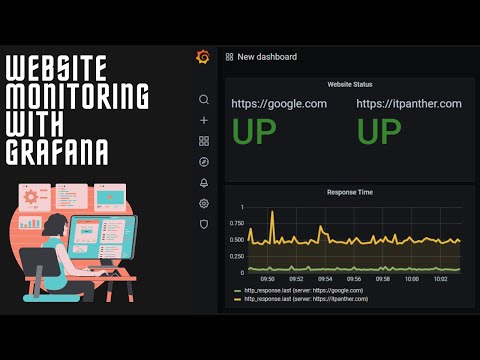
Monitor Websites With #Grafana InfluxDb and Telegraf - Synthetic Monitoring Using Grafana & Telegraf

Показать описание
Want to connect on Instagram? Here is my id @vikasjha001 ✔️ Join Grafana Group on Telegram to ask any questions:
Connect to me:
💥 LinkedIn
📷 Instagram
✈️ Channel
Do subscribe for more tutorials.
============================================
Get complete latest Grafana Course on Udemy which teaches below topics:
Here is what you will learn in the course:
📘 Grafana Introduction
📘 Grafana Overview and Overall Architecture
📘 Installing Grafana on a Linux erver
📘 Installing Grafana on Windows
📘 tarting, topping Grafana ervices on Windows
📘 Installing Grafana on Docker
📘 Creating Grafana Dashboards
📘 Grafana User Interface Overview
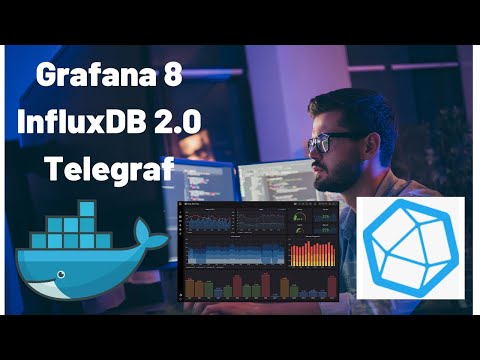
📘 Installing and Managing InfluxDB ervices
📘 Installing and Managing Telegraf ervices
📘 Grafana Dashboard - erver Health ummary Dashboard
📘 Graph Panel - CPU & Memory Utilization
📘 Graph Panel - Multiple ervers & Problem tatement to use Grafana Variables
📘 Custom Variable - tatic Variable Values
📘 Query Variable - Dynamic Variable Values
📘 Dependent Varialbes - Cascaded Variables
📘 Automatic Repeat Panel Based on Variable Value
📘 Organizing Panels and Dashboards for Easy Management
📘 Repeat Row to Create Dynamic Grafana "ummary Dashboard"
📘 Fixing Y Axis' Minimum and Maximum Value in Graph Panel
📘 Creating Thresholds in Graph Visualizations
📘 Python Program to Increase Memory Utilization for Testing Purpose
📘 Creating Thresholds in Graph Visualization and tatsD Graphs
📘 Advance Tabular Visualization With Gauge in one column
📘 Advance tat Visualization in Grafana 7
📘 Exploring More Visualization Properties - Legends, Axis, eries Override
📘 Creating Grafana Dashboard Using MyQL As Data ource
📘 Using Custom QL Query to Create Dashboard
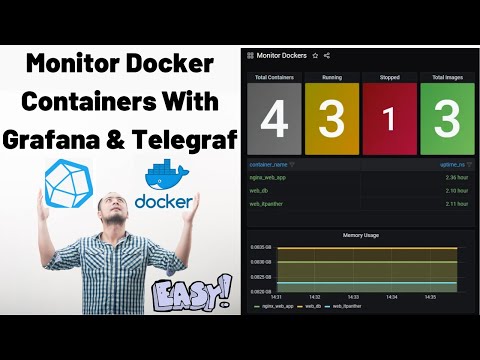
📘 Monitoring Websites and Docker ervices
📘 Monitoring Websites or URL Using Grafana
📘 Monitor Docker ervices
📘 Installing Plugins
📘 Installing Plugins and Creating Pie Chart Visualization
📘 Creating Alerts and Annotation in Dashboards in Grafana
📘 Grafana Email Alerts Configuration
📘 Grafana and Telegram Integration and Alerts Configuration
📘 Users and Roles Creation and Management in Grafana
📘 User and Roles Creation in Grafana
📘 Embedding Grafana Panel on Any Website
📘 Embedding Grafana Panel in any HTML Page (Website)
📘 Upgrading Grafana From Version 6 to Version 7 (Latest Version)
📘 Optional - Upgrade Grafana From Version 6 to Version 7
📘 Optional - Changing Grafana Database to MyQL
✔️ Join Grafana Group on Telegram to ask any questions:
✔️ Connect to me:
💥 LinkedIn
📷 Instagram
✈️ Channel
Do subscribe for more tutorials.
============================================
#LearnGrafanaByVikasJha #Grafana #VikasJha ign up to killshare using this link and get one month free membership.
🤝 For collaboration or other inquiries connect
📞 Whatsapp: +917042103414
Connect to me:
✈️ Channel
Do subscribe for more tutorials.
============================================
Get complete latest Grafana Course on Udemy which teaches below topics:
Here is what you will learn in the course:
📘 Grafana Introduction
📘 Grafana Overview and Overall Architecture
📘 Installing Grafana on a Linux erver
📘 Installing Grafana on Windows
📘 tarting, topping Grafana ervices on Windows
📘 Installing Grafana on Docker
📘 Creating Grafana Dashboards
📘 Grafana User Interface Overview
📘 Installing and Managing InfluxDB ervices
📘 Installing and Managing Telegraf ervices
📘 Grafana Dashboard - erver Health ummary Dashboard
📘 Graph Panel - CPU & Memory Utilization
📘 Graph Panel - Multiple ervers & Problem tatement to use Grafana Variables
📘 Custom Variable - tatic Variable Values
📘 Query Variable - Dynamic Variable Values
📘 Dependent Varialbes - Cascaded Variables
📘 Automatic Repeat Panel Based on Variable Value
📘 Organizing Panels and Dashboards for Easy Management
📘 Repeat Row to Create Dynamic Grafana "ummary Dashboard"
📘 Fixing Y Axis' Minimum and Maximum Value in Graph Panel
📘 Creating Thresholds in Graph Visualizations
📘 Python Program to Increase Memory Utilization for Testing Purpose
📘 Creating Thresholds in Graph Visualization and tatsD Graphs
📘 Advance Tabular Visualization With Gauge in one column
📘 Advance tat Visualization in Grafana 7
📘 Exploring More Visualization Properties - Legends, Axis, eries Override
📘 Creating Grafana Dashboard Using MyQL As Data ource
📘 Using Custom QL Query to Create Dashboard
📘 Monitoring Websites and Docker ervices
📘 Monitoring Websites or URL Using Grafana
📘 Monitor Docker ervices
📘 Installing Plugins
📘 Installing Plugins and Creating Pie Chart Visualization
📘 Creating Alerts and Annotation in Dashboards in Grafana
📘 Grafana Email Alerts Configuration
📘 Grafana and Telegram Integration and Alerts Configuration
📘 Users and Roles Creation and Management in Grafana
📘 User and Roles Creation in Grafana
📘 Embedding Grafana Panel on Any Website
📘 Embedding Grafana Panel in any HTML Page (Website)
📘 Upgrading Grafana From Version 6 to Version 7 (Latest Version)
📘 Optional - Upgrade Grafana From Version 6 to Version 7
📘 Optional - Changing Grafana Database to MyQL
✔️ Join Grafana Group on Telegram to ask any questions:
✔️ Connect to me:
✈️ Channel
Do subscribe for more tutorials.
============================================
#LearnGrafanaByVikasJha #Grafana #VikasJha ign up to killshare using this link and get one month free membership.
🤝 For collaboration or other inquiries connect
📞 Whatsapp: +917042103414
 0:14:50
Monitor Websites With #Grafana InfluxDb and Telegraf - Synthetic Monitoring Using Grafana & Tele...
 0:11:32
Monitor Website Health with Grafana | Website Health, Ping, DNS responses beautiful realtime graphs
 0:16:02
How to Setup a Grafana Dashboard Step-by-Step | Grafana Tutorial for Beginners
 0:36:08
NEXT LEVEL STATISTICS - Home Assistant InfluxDB and Grafana
 0:13:19
Learn Grafana 8 and Prometheus - Monitoring Website Synthetic Monitoring - Lesson 15
 0:08:38
Monitor SNMP devices with Grafana, Telegraf and InfluxDB
 0:06:38
Embedding Grafana Dashboard in Iframe HTML or Website
 0:10:39
Create a SLICK Dashboard for your homelab using Grafana, Telegraf and InfluxDB.
 0:24:36
Server Monitoring // Prometheus and Grafana Tutorial
 0:03:03
Prescient: How to use HTTP APIs for GRAFANA in 3 MINUTES
 0:09:53
Dashboards for DAYS! - How we use Grafana in our #homelab!
 0:12:31
Cisco Model-Driven Telemetry tutorial with Telegraf, InfluxDB, and Grafana!
 0:12:52
📊 - Display JUnit 5 Test Metrics in Grafana Using InfluxDB - Part 4
 0:12:03
Grafana Dashboard with JSON APIs. visualize JSON, CSV, Graphql, XML in grafana
 0:17:52
How to monitor multiple servers in Grafana with InfluxDB Telegraf on Ubuntu 20.04 LTS in Urdu Hindi
 0:12:32
Raspberry Pi IoT Server Tutorial: InfluxDB, MQTT, Grafana, Node-RED & Docker
 0:11:17
Grafana 8 InfluxDB 2 and Telegraf | Create First Grafana Dashboard
 0:17:15
Installing InfluxDB, Telegraf and Grafana Dashboards
 0:27:31
GRAFANA - Erklärt und angeschaut. Performance & Monitoring Dashboard #Grafana #InfluxDB
 0:22:44
How To Setup Influxdb Telegraf And Grafana | Telegraf Influxdb Grafana Tutorial
 0:05:08
How to collect vSphere metrics and create grafana dashboards
 0:16:30
How to Monitor Nginx with Prometheus and Grafana? (Step-by-Step - Install - Monitor - Fluentd)
 0:05:54
How to turn Powershell data into dashboards with Influxdb and Grafana
 0:21:12
Monitoring #Docker Using #Grafana | Monitor Docker Containers with Grafana
Комментарии