filmov
tv
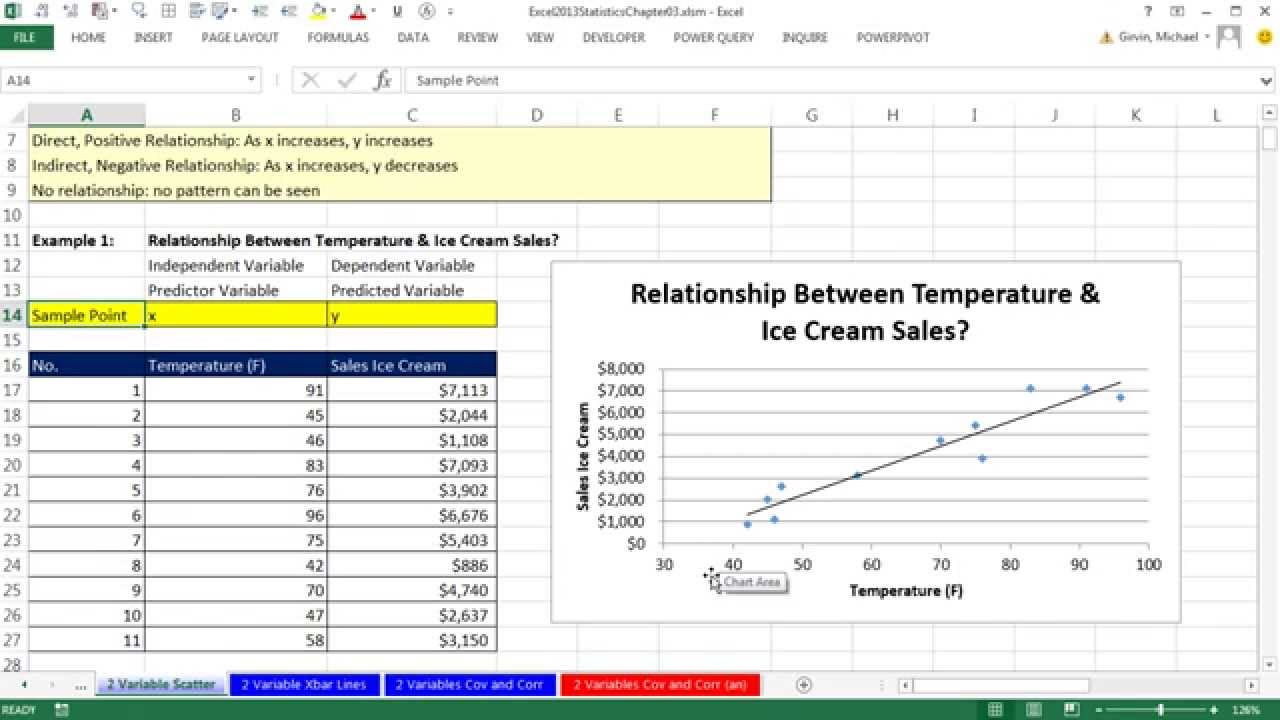
Excel 2013 Statistical Analysis #24: Numerical Measures: Covariance and Correlation Coefficient
Показать описание
Topics in this video:
1. (00:15) Review of different X-Y Scatter
2. (02:42) Add Xbar Line and Ybar Line to X Y Scatter Chart to help interpret how Covariance is calculated and why the math behind the calculation makes sense
3. (08:36) Formulas and Calculations for Covariance and Correlation Coefficient (Long Hand)
4. (12:38) COVARIANCE.S Excel function for calculation Sample Covariance
5. (13:41) Correlation Coefficient & PEARSON Excel function for calculation Correlation Coefficient
6. (16:11) CORREL Excel function for calculation Correlation Coefficient
7. (18:50) Summary
 0:19:22
Excel 2013 Statistical Analysis #24: Numerical Measures: Covariance and Correlation Coefficient
 0:25:55
Office 2013 Class #41: Excel Basics 23: Sort and Filter, Basic Data Analysis (24 Examples)
 0:32:40
Office 2013 Class #42: Excel Basics 24: Pivot Tables for Data Analysis (21 Examples)
 0:12:17
Excel 2013 Statistical Analysis #54: 1 Tail Left Mean Hypothesis Z Test: P-value & Critical Valu...
 0:14:29
Excel 2013 Statistical Analysis #62: Calculate Slope and Intercept for Regression Line
 2:22:43
Excel 2013 Statistical Analysis #01: Using Excel Efficiently For Statistical Analysis (100 Examples)
 0:24:16
Excel 2013 Statistical Analysis #70: Sampling Distribution of Pbar1 – Pbar2, Mean & Standard Err...
 0:26:57
Excel 2013 Statistical Analysis #43: Simple Random Sampling in Excel: Process & Theory
 1:40:01
How To Switch to Tech From a Non-Tech Background- AlmaBetter Free Masterclass
 0:09:01
Excel 2013 Statistical Analysis #37: Introduction to Continuous Probability Distributions
 0:13:05
Excel 2013 Statistical Analysis #14: VLOOKUP to Add New Field To Table & Create Cross Tabulation
 0:37:51
Excel 2013 Statistical Analysis #33: Binomial Probability Distributions: Tables, Charts, Functions
 0:32:08
Excel 2013 Statistical Analysis #31: Create Discrete Probability Distribution, Calculate Mean and SD
 0:00:14
How to calculate AVERAGE in Excel?(with Formula) | AVERAGE Function #shorts #excel
 0:29:59
Excel 2013 Statistical Analysis #20: Standard Deviation: How Fairly Does Mean Represent Data Points?
 0:23:45
Excel 2013 Statistical Analysis #34: POSSION Distribution and POISSON.DIST Function
 0:00:29
Conditional Formatting in Excel | Highlight Marks Pass/Fail #shorts #excel
 0:32:40
Office 2013 Class #42 Excel Basics 24 Pivot Tables for Data Analysis 21 Examples
 0:00:29
Fill Serial Numbers in Excel Efficiently with Formula
 0:31:54
Excel 2013 Statistical Analysis #22: Z-Score = # of Standard Deviations, Chebshev’s &Empirical R...
 0:00:22
How to Create List of Dates in Excel? (In 20 Seconds) #shorts #excel #exceltricks
 0:28:04
Excel 2013 Statistical Analysis #71: Inference About Difference Between 2 Pop. Proportions Z Method
 0:00:24
Change number in date format | Excel formulas | Text Function
 0:00:20
Get Percentage Total Easy in Excel | get percentage in excel | #youtubeshorts #excelshorts#excel2022
Комментарии