filmov
tv
Excel 2013 Statistical Analysis #34: POSSION Distribution and POISSON.DIST Function

Показать описание
Topics in this video:
1. (00:24) Look at Data Set that exhibits the characteristics of a Poisson Experiment and compare it to the results of the POISSON.DIST to helps us understand why when can use this function to make probability predictions.
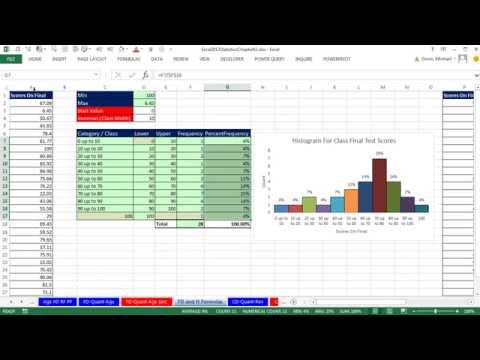
2. (05:57) Chart a POISSON Distribution with a column chart
3. (09:16) Discussion of POISSON experiment and POISSON.DIST Discrete Probability Distribution
4. (12:23) Use POISSON.DIST for arrivals at Dick’s Hamburger Restaurant
5. (17:14) Use POISSON.DIST for arrivals at an Accounting Tutoring Center
6. (18:20) Use POISSON.DIST for water line breaks in a 100 Mile stretch of pipe
1. (00:24) Look at Data Set that exhibits the characteristics of a Poisson Experiment and compare it to the results of the POISSON.DIST to helps us understand why when can use this function to make probability predictions.
2. (05:57) Chart a POISSON Distribution with a column chart
3. (09:16) Discussion of POISSON experiment and POISSON.DIST Discrete Probability Distribution
4. (12:23) Use POISSON.DIST for arrivals at Dick’s Hamburger Restaurant
5. (17:14) Use POISSON.DIST for arrivals at an Accounting Tutoring Center
6. (18:20) Use POISSON.DIST for water line breaks in a 100 Mile stretch of pipe
 0:23:45
Excel 2013 Statistical Analysis #34: POSSION Distribution and POISSON.DIST Function
 0:37:51
Excel 2013 Statistical Analysis #33: Binomial Probability Distributions: Tables, Charts, Functions
 2:22:43
Excel 2013 Statistical Analysis #01: Using Excel Efficiently For Statistical Analysis (100 Examples)
 0:02:54
Excel 2010 Statistics #34: Data Analysis Add-in Descriptive Statistics tool
 0:18:59
EXCEL 2013 Chapter 34: Introducing Pivot Tables / Chapter 35: Analyzing Data with Pivot Tables
 0:41:36
Excel 2013 Statistical Analysis #8: Frequency Distributions, Histograms, Skew, Quantitative Variable
 0:08:56
Excel Statistical Analysis 34: Answering Probability Questions With NORM.DIST Function
 0:09:01
Excel 2013 Statistical Analysis #37: Introduction to Continuous Probability Distributions
 0:32:08
Excel 2013 Statistical Analysis #31: Create Discrete Probability Distribution, Calculate Mean and SD
 0:19:22
Excel 2013 Statistical Analysis #24: Numerical Measures: Covariance and Correlation Coefficient
 0:07:51
Excel 2013 Statistical Analysis #35: Hypergeometric Distribution and HYPGEOM.DIST Function
 0:23:08
Excel 2013 Statistical Analysis #73: Chi-Square Test Independence 2 Categorical Var. (PivotTables)
 0:26:57
Excel 2013 Statistical Analysis #43: Simple Random Sampling in Excel: Process & Theory
 0:04:00
Office 2013 Class #34: Excel Basics 16: Flash Fill To Combine or Extract Text
 0:12:48
Highline Excel 2013 Class Video 34: Excel Subtotals, Add Subtotals based on One or Two Columns
 0:01:15
Excel 2013 Statistical Analysis #2: Install Data Analysis Add-in For Amazing Excel Statistical Tools
 0:15:05
Excel 2013 Statistical Analysis #38: Uniform Probability Distribution
 0:19:41
Excel 2013 Statistical Analysis #36: Dynamic Binomial Probability Charts (3 Examples)
 0:06:30
Excel 2013 Statistical Analysis #29: Create Joint Probability Table from Raw Data & Calc Event P...
 0:09:41
Excel 2013 Statistical Analysis #32: Expected Value Standard & Deviation Discrete Prob. Distribu...
 0:33:18
Excel 2013 Statistical Analysis #28: Multiplication Law of Probability AND Events (16 Examples)
 0:41:11
Excel 2013 PivotTables & Charts for Descriptive Statistics From Raw Data Sets (5 Examples) Math ...
 0:00:24
Change number in date format | Excel formulas | Text Function
 0:15:13
Excel 2013 Statistical Analysis #40: Normal (Bell) Probability Distribution Area Chart, X & Z Va...
Комментарии