filmov
tv
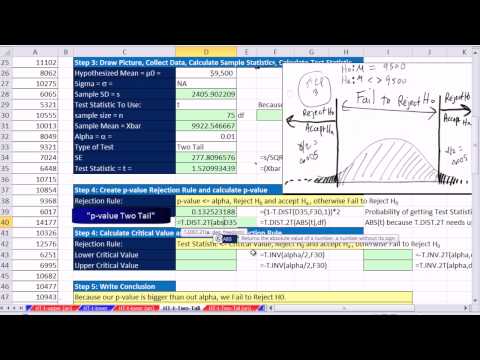
Excel 2013 Statistical Analysis #54: 1 Tail Left Mean Hypothesis Z Test: P-value & Critical Value

Показать описание
Example of 1 tail test on the left (lower end) for mean catchup bottle weight when consumer group suspects that mean weight is below advertised amount, using critical value and p-value. See the Excel functions: COUNT, AVERAGE, ROUND, NORM.S.DIST and NORM.S.INV
 0:12:17
Excel 2013 Statistical Analysis #54: 1 Tail Left Mean Hypothesis Z Test: P-value & Critical Valu...
 0:38:09
Excel 2013 Statistical Analysis #53: 5 Steps Hypothesis Testing: P-value & Critical Value Method...
 2:22:43
Excel 2013 Statistical Analysis #01: Using Excel Efficiently For Statistical Analysis (100 Examples)
 0:07:22
Excel 2013 Statistical Analysis #13: Scatter Chart & Trendline, X Y Data, 2 Quantitative Variabl...
 0:06:30
Excel 2013 Statistical Analysis #29: Create Joint Probability Table from Raw Data & Calc Event P...
 0:12:15
Excel 2013 Statistical Analysis #55: 2 Tail Z Score Mean Hypothesis Testing P-value Critical Value
 0:09:01
Excel 2013 Statistical Analysis #37: Introduction to Continuous Probability Distributions
 0:20:15
Excel 2013 Statistical Analysis #50: t Distribution Confidence Intervals Sigma NOT Known 3 Examples
 0:33:32
Excel 2013 Statistical Analysis #06: Frequency Distributions & Column Charts, Categorical Variab...
 0:09:54
Excel 2013 Statistical Analysis #49: Create Confidence Intervals Sigma Known Z-Score (3 Methods)
 0:24:08
Excel 2013 Statistical Analysis #39: Probabilities for Normal (Bell) Probability Distribution
 0:12:42
Excel 2013 Statistical Analysis #57: 1 Tail Right Mean Hypothesis T Test P-value & Critical Valu...
 0:16:12
Excel 2013 Statistical Analysis #66: Confidence Interval for Population Differences Sigma NOT Known
 0:20:48
Excel 2013 Statistical Analysis #68: Matched/Paired Samples Population Differences Sigma NOT Known
 1:25:17
What's New In Excel 2013: Flash Fill, Functions, Data Model, PowerPivot, New Charts, Table Slic...
 0:10:23
Excel 2013 Statistical Analysis #59: 2 Tail Mean Hypothesis T Test: P-value & Critical Value
 0:14:02
Excel 2013 Statistical Analysis #48: Introduction to Confidence Intervals
 0:24:15
Excel 2013 Statistical Analysis #16: Location: Mean, Median, Mode for Central Location
 0:09:34
Basic Excel Business Analytics #18: Data Analysis Add-in for Frequency Distribution & Histogram
 0:17:29
Excel 2013 Statistical Analysis #67: Hypothesis Testing for Population Differences Sigma NOT Known
 0:20:17
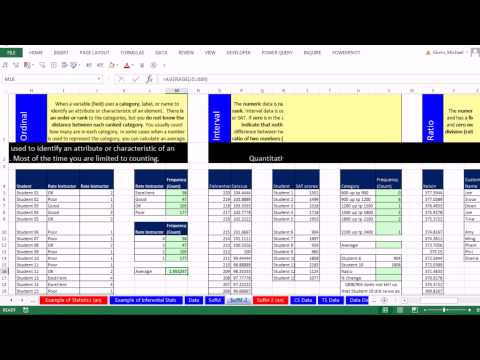
Excel 2013 Statistical Analysis #5 Data Categorical, Quantitative, Nominal, Ordinal, Interval, Ratio
 0:08:55
Excel 2013 Statistical Analysis #56: NORM.S.DIST = p-value, NORM.S.INV = Critical Value Sigma Known
 0:26:20
Excel 2013 Statistical Analysis #63: Sampling Distribution of Xbar1 – Xbar2 & Standard Error
 0:09:09
Excel 2013 Statistical Analysis #58: 1 Tail Left T Score Mean Hypothesis Test P-value Critical Value
Комментарии