filmov
tv
5 ways to calculate last 12 months in DAX for Power BI

Показать описание
This video you learn 5 ways in which you can calculate the last 12 months in DAX. The goal is to master different ways to reach the same result.
Which method is your favorite?
WRITTEN BLOGPOST:
Master Functions and Syntax in M
0:00 Introduction
0:45 The scenario
1:05 Version 1: DATESINPERIOD
3:14 Version 2: DATESBETWEEN
5:25 Version 3: Using an Index Column
8:12 Version 4: MAXDATE and EDATE
9:44 Version 5: LASTDATE and SAMEPERIODLASTYEAR
ABOUT BI Gorilla:
BI Gorilla shares videos and articles on Power BI and Excel to help you improve your skills.
SUPPORT MY CHANNEL
SUBSCRIBE TO MY CHANNEL
LET'S CONNECT:
Thank you for your support!
#PowerQuery #Last12Months #BIGorilla
 0:11:57
5 ways to calculate last 12 months in DAX for Power BI
 0:12:11
How to Calculate Percentages: 5 Easy Methods
 0:00:30
How To Calculate Faster than a Calculator
 0:01:48
Final Exam Grade Needed (How to Calculate)
 0:00:56
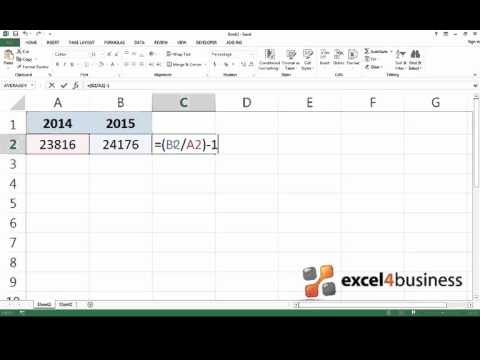
How to Calculate Percent Change in Excel
 0:00:45
Calculate hours between two times
 0:07:20
How to Calculate Faster than a Calculator - Mental Math #1
 0:00:36
How To Calculate Percentage In Google Sheets
 0:00:36
EASY METHOD TO WRITE TABLE OF 89.#shorts #youtube shorts
 0:08:00
How to Calculate Faster than a Calculator - Mental Maths #2| Addition and Subtraction
 0:00:28
How to Calculate the Percentage in Excel (Formula)
 0:00:19
How To Calculate Percents In Your Head
 0:02:23
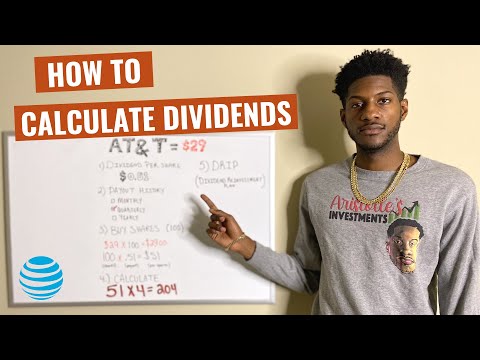
HOW TO CALCULATE DIVIDENDS: 5 EASY STEPS
 0:31:16
This is how to calculate and know your star and star number, using your date of birth by yourself.
 0:03:15
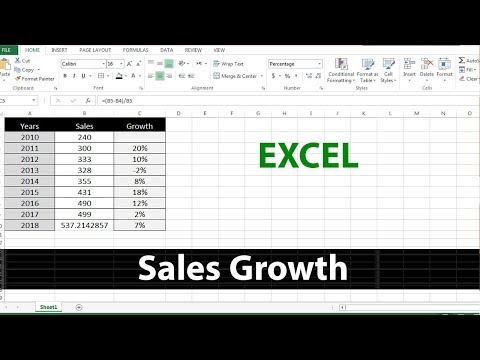
How to Calculate Sales Growth in Excel
 0:00:26
Pregnancy - How do I calculate my due date?
 0:05:42
How to Calculate Faster than a Calculator - Mental Maths #1
 0:02:16
How to Calculate Tenure (period of service) in Excel
 0:00:34
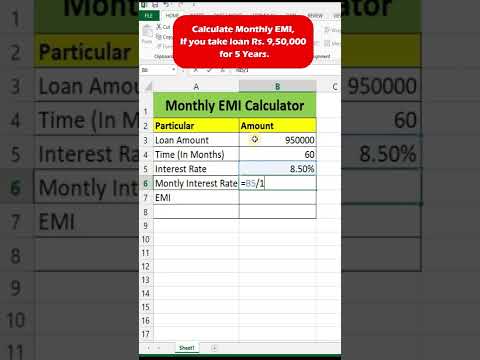
Calculate Monthly EMI for your loan amount🤩🤩
 0:01:45
Kutools For Excel | How To Calculate Annual Leave In Excel ?
 0:03:25
How to Calculate Present Value on Calculator - Easy Way
 0:00:42
KW to HP Calculate| kw to HP conversion| how to convert kW to HP| kw to HP convert formula.
 0:00:30
Trick to calculate salary increment 💪😎 #advancedexcel #excelshorts
 0:02:42
How To Calculate A Test Grade In 5 Steps
Комментарии