filmov
tv
#1 How Prometheus and Grafana works | Prometheus Architecture explained - DevOps - (Hindi/Urdu)

Показать описание
What’s new in Grafana
What is Prometheus?
Prometheus is an open-source system
monitoring
What are metrics ?
the architecture of Prometheus
Prometheus scrapes
FIRST STEPS WITH PROMETHEUS
Downloading Prometheus
Configuring Prometheus
Starting Prometheus
Monitoring other targets
Downloading and running Prometheus
Configuring Prometheus to monitor itself
Configure Prometheus to monitor the sample target
Configure rules for aggregating scraped data into new time series
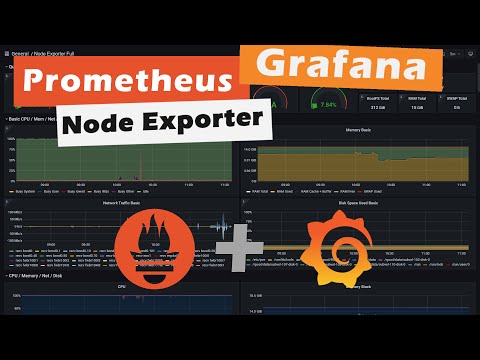
In this video, I explain about Prometheus and Grafana architecture and how Prometheus and Grafana works , Prometheus server , Alertmanager , Service Discovery , Targets , SMTP mail server , Node exporters , Pull/Push metrics ,Ttime series database , PromQL , Data visuals , Grafana dashboards , Grafana Email Alerts.
I am here to provide you the easy and best ways to resolve your day in day out technical problems.
Will try my level best to provide you the real practical solutions for your real time experience !!
Learn #Prometheus and create dashboards in #Grafana
This guide is a "Code with me tutorial which shows how to install, configure, and use a simple Prometheus instance. You will download and run Prometheus locally, configure it to scrape itself and an example application, then work with queries, rules, and graphs to use collected time series data.
Configuring Prometheus to monitor itself
Prometheus collects metrics from targets by scraping metrics HTTP endpoints. Since Prometheus exposes data in the same manner about itself, it can also scrape and monitor its own health.
Starting Prometheus
To start Prometheus with your newly created configuration file, change to the directory containing the Prometheus binary and run:
# Start Prometheus.
Using the graphing interface
 0:21:31
 0:24:36
 0:36:42
 1:09:32
 0:20:16
 0:21:23
 0:10:38
 0:25:42
 0:01:00
 0:25:27
 0:13:51
 0:25:28
 0:27:41
 0:25:36
 0:32:12
 0:23:57
 1:39:55
 0:14:26
 0:11:14
 0:32:12
 0:17:19
 0:14:57
 0:18:23
 0:45:39