filmov
tv
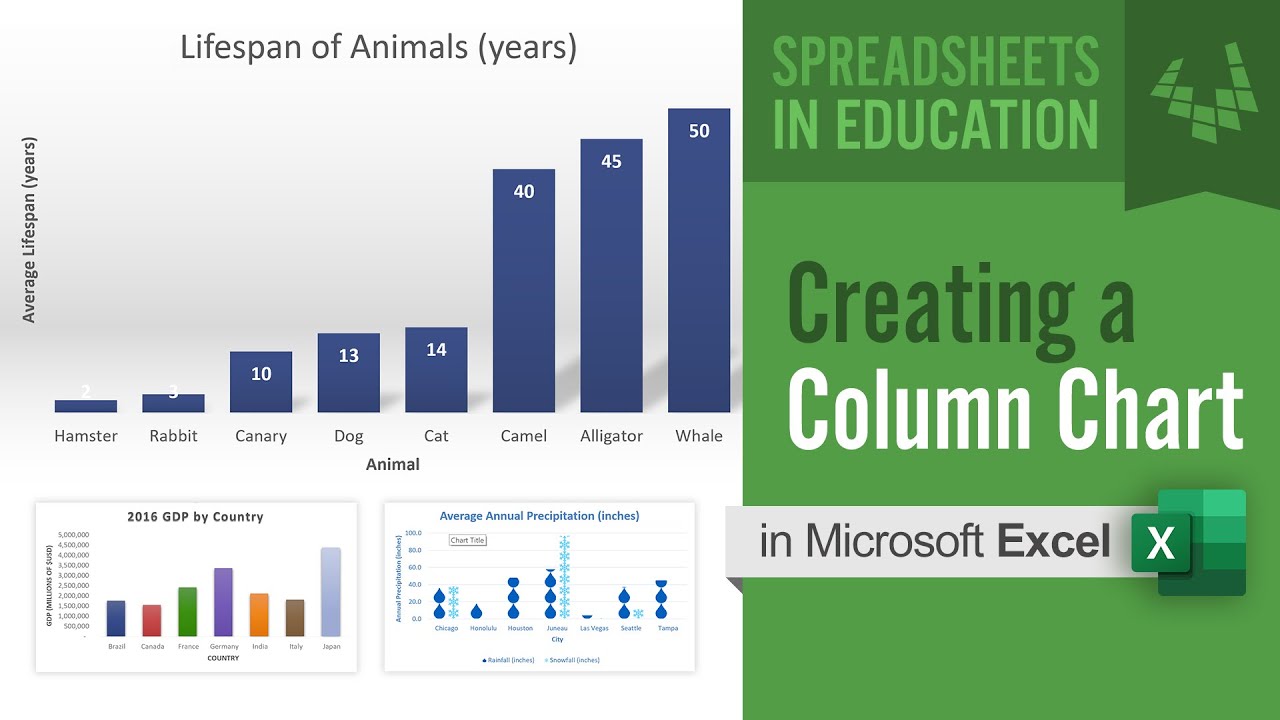
Creating a Column Chart or Bar Chart in Excel
Показать описание
0:00 What is a column chart?
0:16 How to set up the data table for the chart
0:47 Insert a clustered column chart or bar chart
1:21 Add axis titles by linking or editing manually
1:55 Add a second data series to your existing chart
2:30 Change the column chart to a bar chart
2:50 Customizing and styling the chart
3:35 Turn your column chart into an awesome pictograph
Don't Forget to Subscribe! 😃
FOLLOW VERTEX42 HERE:
LOOKING FOR SPREADSHEET TEMPLATES? Start Here:
 0:05:51
How to insert a Column chart in Excel Tutorial
 0:02:12
How to create a Column Chart in Excel
 0:06:43
MS Excel - Column Chart
 0:02:28
Making a Bar Chart
 0:05:14
Making a Simple Bar Graph in Excel
 0:04:28
Creating a Column Chart in Google Sheets
 0:03:31
How to Make Bar Chart Race Video | Tutorial
 0:11:05
Excel Column Chart - Stacked and Clustered combination graph
 0:00:59
Tableau Interview Quick Start
 0:04:44
Creating a Column Chart or Bar Chart in Excel
 0:03:20
How to Make a Bar Graph in Excel
 0:00:43
Excel create bar chart with trend lines | 30 seconds
 0:05:31
How To Create A Bar Chart In Excel (Super Easy!)
 0:01:19
Make a Combination Column and Line Chart in Excel 2016 or later
 0:09:52
Create A Column Chart That Shows Percentage Change In Excel - Part 1
 0:03:11
How To Combine A Line And Column Chart In Excel
 0:05:09
2.1 Stunning Column Charts in Power BI Tutorials for Beginners by Pavan Lalwani | Power Bi charts
 0:02:15
How to create a Clustered Stacked Column Chart in Excel
 0:14:10
Excel Charts & Graphs: Learn the Basics for a Quick Start
 0:07:52
7 minutes trick to Bar Chart or Gantt Chart in Excel | Smart Project Management
 0:01:34
How to create 3D Column Chart in MS Office Excel 2016
 0:01:31
How to create a column chart in Microsoft Access
 0:13:49
Bar chart with differences in Excel
 0:04:00
Bar Graphs for 2nd Grade Kids - Create your own Bar Graph
Комментарии