filmov
tv
How to Create a Gantt Chart in 9 Easy Steps

Показать описание
In an earlier video, I described what a Gantt Chart is, in under 5 minutes. But I keep getting asked how to create one. So, in this video, I’ll show you exactly how to make a Gantt Chart.
1. List your Tasks
The best place to start for this step is with your Work Breakdown Structure (WBS). Whether you represent your WBS as products or tasks, you can still get at the tasks easily.
2. Set Your Constraints
Do any of your tasks have fixed start or completion dates that you have to respect. Add this information to your list of tasks.
3. Set Your Dependencies
Which tasks are dependent upon others? Usually, these will be Finish-to-Start dependencies, but others are possible though far less common.
Once you have your dependencies, there are two things you can do:
• Add in any lags or leads
• A lag is a gap between the tasks that are dependent. For example,
• Sequence the tasks within a group, to make your final Gantt Chart easier to read.
4. Allocate Resources to Tasks
Identify the right resources (people) for each task. Check their availability and confirm their willingness to work on the task.
Where two tasks use the same person, you won’t be able to schedule them to happen at the same time – unless the person is working part-time on each.
5. Estimate Durations
For each task, estimate how long it will take the people you have allocated to that task to complete it.
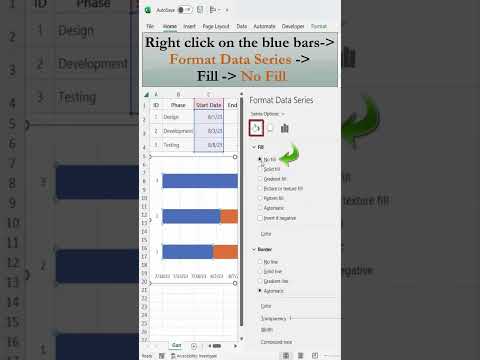
6. Create Your Gantt Chart Grid or Template
A Gantt Chart has rows that represent the tasks and columns that represent days, weeks, or some other time interval.
7. Plot Your Activities onto Your Chart
8. Add Milestones to Your Chart
You can decide your milestones up-front, at the start of the process (Milestone Planning) and use them as constraints to help you plan. Or, you can select milestones from the completion of important tasks and groups of tasks. Or a combination of both. We have videos on Milestones for you to watch.
9. Make Your Gantt Chart as Useful as Possible
Apply color-coding and shading to make different tasks stand out. Use colors or labels to associate resources with tasks. Add arrows to indicate dependencies.
Whatever you do to make your Gantt Chart a better communication tool, always remember to add a key or legend, so that users can understand your coding.
Recommended Videos
How does a Gantt Chart fit into your larger Project Plan? Do take a look at our video:
More carefully curated video recommendations for you:
A while back, I asked Project Managers in a couple of forums what material things you need to have, to do your job as a Project Manager. They responded magnificently. I compiled their answers into a Kit list.
Note that the links are affiliated.
#Project #ProjectManagement #GanttChart
1. List your Tasks
The best place to start for this step is with your Work Breakdown Structure (WBS). Whether you represent your WBS as products or tasks, you can still get at the tasks easily.
2. Set Your Constraints
Do any of your tasks have fixed start or completion dates that you have to respect. Add this information to your list of tasks.
3. Set Your Dependencies
Which tasks are dependent upon others? Usually, these will be Finish-to-Start dependencies, but others are possible though far less common.
Once you have your dependencies, there are two things you can do:
• Add in any lags or leads
• A lag is a gap between the tasks that are dependent. For example,
• Sequence the tasks within a group, to make your final Gantt Chart easier to read.
4. Allocate Resources to Tasks
Identify the right resources (people) for each task. Check their availability and confirm their willingness to work on the task.
Where two tasks use the same person, you won’t be able to schedule them to happen at the same time – unless the person is working part-time on each.
5. Estimate Durations
For each task, estimate how long it will take the people you have allocated to that task to complete it.
6. Create Your Gantt Chart Grid or Template
A Gantt Chart has rows that represent the tasks and columns that represent days, weeks, or some other time interval.
7. Plot Your Activities onto Your Chart
8. Add Milestones to Your Chart
You can decide your milestones up-front, at the start of the process (Milestone Planning) and use them as constraints to help you plan. Or, you can select milestones from the completion of important tasks and groups of tasks. Or a combination of both. We have videos on Milestones for you to watch.
9. Make Your Gantt Chart as Useful as Possible
Apply color-coding and shading to make different tasks stand out. Use colors or labels to associate resources with tasks. Add arrows to indicate dependencies.
Whatever you do to make your Gantt Chart a better communication tool, always remember to add a key or legend, so that users can understand your coding.
Recommended Videos
How does a Gantt Chart fit into your larger Project Plan? Do take a look at our video:
More carefully curated video recommendations for you:
A while back, I asked Project Managers in a couple of forums what material things you need to have, to do your job as a Project Manager. They responded magnificently. I compiled their answers into a Kit list.
Note that the links are affiliated.
#Project #ProjectManagement #GanttChart
 0:07:44
How to Make Gantt Chart in Excel
 0:08:14
Gantt Chart Excel Tutorial - How to make a Basic Gantt Chart in Microsoft Excel
 0:15:59
How to Make the BEST Gantt Chart in Excel (looks like Microsoft Project!)
 0:06:37
How to create a Gantt Chart in Excel
 0:00:12
Gantt Excel - Fastest Way to Create a Gantt Chart
 0:02:36
Gantt Chart Excel Tutorial - How to make a Basic Gantt Chart in Microsoft Excel 2016
 0:10:02
How to Create a Gantt Chart in 9 Easy Steps
 0:17:13
Make This Awesome Gantt Chart in Excel (for Project Management)
 0:10:41
How to Create a Gantt Chart in Google Sheets
 0:02:14
How To Make Gantt Chart In Excel - Full Guide
 0:09:23
How to Create a Gantt Chart in Microsoft Project (Microsoft Project for Beginners)
 0:05:29
Easy way to make Gantt Chart in Excel
 0:11:20
How to Quickly Make a Gantt Chart in Excel
 0:03:56
How to Create a Basic Gantt Chart in Microsoft Project 2022
 0:07:16
How To Create A Gantt Chart With A Progress Bar To Show Percentage Completion Of Tasks In Excel
 0:09:36
TECH-005 - Create a quick and simple Time Line (Gantt Chart) in Excel
 0:01:00
How to Create a Gantt Chart in Excel
 0:07:02
How to Make a Gantt Chart Using Excel [EASIEST GANTT CHART METHOD]
 3:18:01
How to create Ultimate Excel Gantt Chart for Project Management (with Smart Dependency Engine)
 0:16:29
PROJECT MANAGEMENT in Power BI? Create a GANTT CHART from a bar chart | NO CUSTOM VISUAL solution
 0:08:28
How to Create a Gantt Chart in Excel in 10 Minutes! (FREE Download Included!)
 0:06:43
How to Create a Gantt Chart | TeamGantt Tips
 0:01:00
Gantt Chart in Excel | 60 Seconds Tutorial #shorts
 0:16:22
How to Make a Gantt Chart in Excel - Step by Step Tutorial - Gantt Chart Excel
Комментарии