filmov
tv
Efficient Frontier Explained in Excel: Plotting a 3-Security Portfolio

Показать описание
Delve into the world of portfolio optimization with our step-by-step guide on 'Efficient Frontier Explained in Excel: Plotting a 3-Security Portfolio.' Learn to calculate expected returns and standard deviation for individual securities, assign random weights, and effectively use the Sharpe Ratio and Covariance Matrix for risk management. We conclude with plotting the Efficient Frontier using Monte Carlo Simulation, helping you identify the optimal portfolio.
🎓 Tutor With Me: 1-On-1 Video Call Sessions Available
👨💼 My Freelance Financial Modeling Services:
Chapters:
0:00 - Intro to "Efficient Frontier Explained"
0:41 - Calculate Expected Returns: Individual Securities
3:30 - Calculate Standard Deviation: Individual Securities
4:31 - Assign Random Weights
5:40 - Calculate Total Portfolio Expected Return
6:13 - Create Covariance Matrix
8:31 - Calculate Total Portfolio Standard Deviation
9:29 - Calculate Sharpe Ratio
10:42 - Plot Efficient Frontier Using Monte Carlo Simulation
12:17 - Find the Optimal Portfolio: Portfolio Optimization
*Disclosure: This is not financial advice and should not be taken as such. The information contained in this video is an opinion. Some of the information could be wrong. This channel is owned and operated by Portfolio Constructs LLC
 0:08:47
Graph The Efficient Frontier And Capital Allocation Line In Excel
 0:14:43
Efficient Frontier Explained in Excel: Plotting a 3-Security Portfolio
 0:02:54
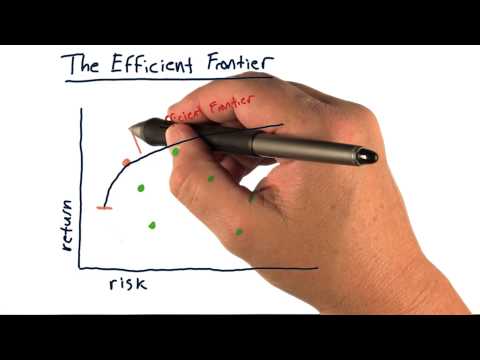
The efficient frontier
 0:03:05
The Efficient Frontier - Explained in 3 Minutes
 0:28:00
Efficient Portfolio Frontier explained: Solver (Excel)
 0:32:47
Use Excel to graph the efficient frontier of a three security portfolio
 0:04:27
How To Graph The Efficient Frontier For A Two-Stock Portfolio In Excel
 0:03:49
Modern Portfolio Theory and the Efficient Frontier Explained
 0:20:07
FRM : How to Build Efficient Frontier in Excel - Part 1 (of 2)
 0:13:05
Efficient Frontier and Portfolio Optimization Explained | The Ultimate Guide
 0:15:38
Plotting Efficient Frontier for Four Securities in Excel
 0:09:33
Efficient Frontier in Excel: Two Asset Case
 0:15:32
13. Graphing the efficient frontier for Multiple Stock portfolio in Excel #Finance
 0:12:02
Calculating The Efficient Frontier Step-by-Step in Excel
 0:35:01
Four Stock Portfolio and Graphing Efficient Portfolio Frontier
 0:17:10
Portfolio Optimization Seven Security Example with Excel Solver
 0:16:07
Efficient Portfolio Frontier explained: two stocks (Excel)
 0:29:23
Efficient portfolio frontiers with allocation constraints (Excel)
 0:19:19
Efficient Frontier | Efficient Frontier Explained in Excel | Modern Portfolio Theory | Markowitz
 0:15:26
Portfolio Optimization in Excel: Step by Step Tutorial
 0:12:59
Constructing the Capital Allocation Line in Excel (between Efficient Frontier and Risk-Free Asset)
 0:01:34
Constructing the Efficient Frontier in 2 minutes in Excel
 0:07:26
Calculating the Efficient Frontier for more than 2 Assets in Excel
 0:04:11
Graphing the Efficient Frontier using Random Portfolios in Excel
Комментарии