filmov
tv
Calculating the Efficient Frontier for more than 2 Assets in Excel

Показать описание
This series on Institutional-Grade Risk Management has so far shown how to calculate the Efficient Frontier for 2 Assets. This episode looks at 3 assets and the process that is required. This approach will take us a step closer to real-world portfolio optimization techniques which we will build on in future episodes.
#EfficientFrontier, #MultipleAssets, #ExcelTutorial, #MultipleStocks, #3Assets, #ManagingRisk, #StandardDeviation, #ExpectedReturn, #EfficientFrontierFor3Assets, #EfficientFrontierCalculation, #EfficientFrontierInExcel, #HowToCalculateTheEfficientFrontier, #Darwinex
Video Contents:
00:00 Efficient Frontier with 3 Assets
00:23 Why Darwinex?
01:12 Constructing the Efficient Frontier in Excel with 3 Stocks
06:15 Summary and Next Episodes
Content Disclaimer: Past performance is not a reliable indicator of future results. The contents of this video (and all other videos by the presenter) are for educational purposes only and are not to be construed as financial and/or investment advice.
 0:02:54
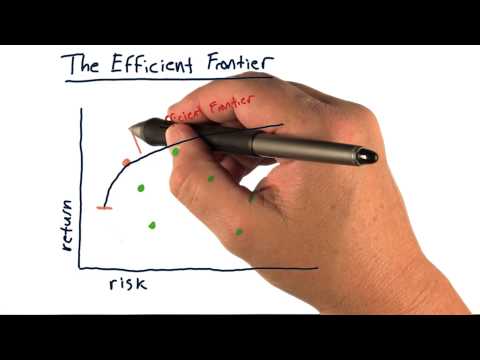
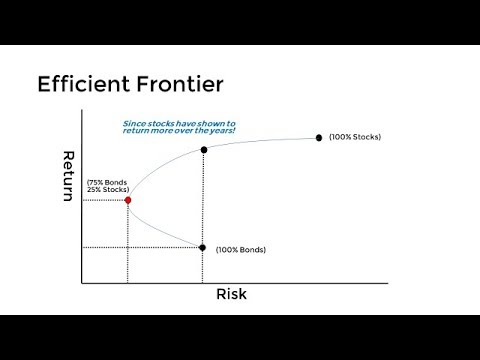
The efficient frontier
 0:08:47
Graph The Efficient Frontier And Capital Allocation Line In Excel
 0:03:05
The Efficient Frontier - Explained in 3 Minutes
 0:07:26
Calculating the Efficient Frontier for more than 2 Assets in Excel
 0:14:43
Efficient Frontier Explained in Excel: Plotting a 3-Security Portfolio
 0:00:55
The efficient compute frontier.
 0:13:05
Efficient Frontier and Portfolio Optimization Explained | The Ultimate Guide
 0:07:00
The Math of Drawing the Efficient Frontier
 0:12:02
Calculating The Efficient Frontier Step-by-Step in Excel
 0:05:45
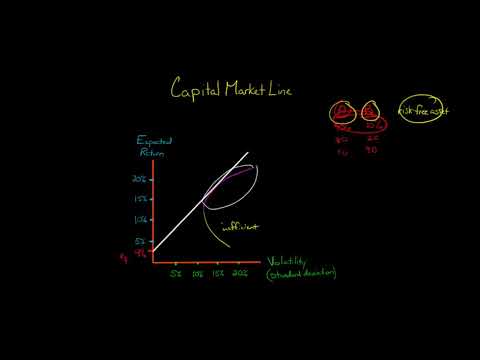
The Capital Market Line
 0:10:37
GFM29 - Calculating the efficient frontier of investments.
 0:09:34
Calculation Exercise - Efficient Portfolios
 0:03:49
Modern Portfolio Theory and the Efficient Frontier Explained
 0:04:27
How To Graph The Efficient Frontier For A Two-Stock Portfolio In Excel
 0:15:38
Plotting Efficient Frontier for Four Securities in Excel
 0:15:32
13. Graphing the efficient frontier for Multiple Stock portfolio in Excel #Finance
 0:20:07
FRM : How to Build Efficient Frontier in Excel - Part 1 (of 2)
 0:03:26
markowitz portfolio theory efficient frontier cfa-course.com
 0:34:57
Graph the efficient frontier and capital allocation line for a three stock portfolio using Excel.
 0:10:31
Concavity of the Efficient Frontier
 0:35:01
Four Stock Portfolio and Graphing Efficient Portfolio Frontier
 0:17:10
Portfolio Optimization Seven Security Example with Excel Solver
 0:32:47
Use Excel to graph the efficient frontier of a three security portfolio
 0:20:08
CFA/FRM : How to Build Efficient Frontier in Excel- CAL and Use of Sharpe Ratio [Part 2 of 2]
Комментарии