filmov
tv
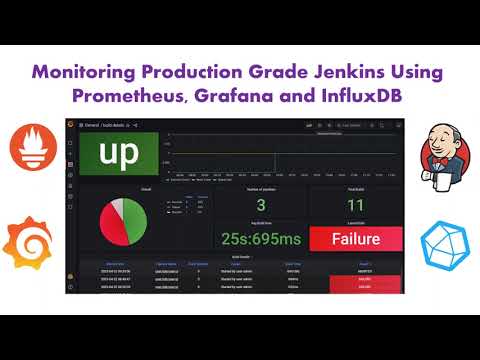
Monitoring With Grafana | Monitoring Production grade Jenkins using Prometheus, Grafana & InfluxDB
Показать описание
In this video I have discussed about monitoring production Jenkins using prometheus, influxdb and grafana.
Pre-requisites to watch this video are
✔️ Basic Docker concepts
✔️ Basic Idea on tools like Prometheus, Grafana & InfluxDB
✔️ Basic of sql queries
💥 💥 Time-stamps 💥 💥
0:00 - Intro
1:00 - Brief explanation about Dashboard
7:14 - Setup steps
8:35 - Creating Setup
44:50 - Creating Dashboard
📂Git Repositories 📂
If you like the video like ✅, share 🔁 and subscribe 🔔
Happy Learning 📚📖📕
You can follow me on
Grafana Monitoring || Jenkins Monitoring || Jenkins real time monitoring
 0:24:36
Server Monitoring // Prometheus and Grafana Tutorial
 0:04:32
Grafana Explained in Under 5 Minutes ⏲
 0:03:22
How real user monitoring works in Grafana Cloud Frontend Observability
Monitoring With Grafana | Monitoring Production grade Jenkins using Prometheus, Grafana & Influx...
 0:00:37
How Prometheus and Grafana works? #devops #monitoring
 1:02:00
Grafana Tutorial For Beginners | Continuous Monitoring With Grafana | DevOps Training | Edureka
 0:27:41
Beautiful Dashboards with Grafana and Prometheus - Monitoring Kubernetes Tutorial
 0:25:27
🔥 Server Monitoring with Prometheus and Grafana Tutorial
 2:17:46
Tự học az104 phiên bản mới nhất 2024(cloudcert.vn) -P17
 0:23:57
Best Server Monitoring with Prometheus and Grafana using Node Exporter and cAdvisor
 0:39:16
30 Days Of DevOps | Zero To Hero | Monitoring With Grafana | Day-21
 0:25:28
Homelab Monitoring Made Easy - Part 1: Tools Overview - Grafana, Prometheus, InfluxDB, Telegraf
 0:26:03
Grafana Dashboard📊: Monitor CPU, Memory, Disk and Network Traffic Using Prometheus and Node Exporter...
 0:07:28
#11 Grafana Monitoring | FREE Beginner course | Collect vSphere Metrics
 0:04:13
Proactively monitor user journeys with Grafana Cloud Synthetic Monitoring
 0:04:39
#12 Grafana Monitoring | FREE Beginner course | Create Network Bandwidth Graphs
 0:51:44
Server Monitoring with Grafana Prometheus and Loki
 0:02:43
Kubernetes Monitoring: How to Get Started in Grafana Cloud | Grafana
 0:32:12
Setup Prometheus & Grafana Monitoring On Kubernetes Using Helm
 0:21:31
How Prometheus Monitoring works | Prometheus Architecture explained
 0:11:32
Monitor Website Health with Grafana | Website Health, Ping, DNS responses beautiful realtime graphs
 0:09:41
Monitoring Docker Containers using Grafana & Prometheus
 0:18:00
Monitoring Jenkins with Grafana and Prometheus
 0:17:02
Grafana : Setup Grafana for Spring Boot app | Actuator, Prometheus & Grafana | Monitoring & ...
Комментарии