filmov
tv
Basic Excel Business Analytics #21: AVERAGE, MEDIAN, MODE.MULT functions & PivotTable Mode

Показать описание
Review the reasons why have three average calculations:
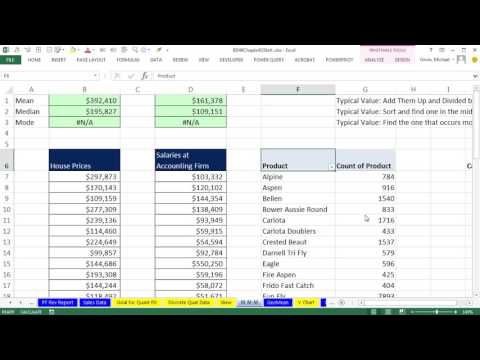
1) (00:11) Mean, Median, Mode = Average = One number that represents all the data points = A measure of central tendency.
2) (00:40) Mean to get a typical value. Add them up, Divide by the count. Use AVERAGE function.
3) (01:26) Median to get a typical value. The middle value in a sorted list. Median is the calculations to make if there are extreme values. Use MEDIAN Function.
4) (03:01) Mode to get a typical value for quantitative or categorical data. Finds the item that occurs most frequently. MODE.SNGL is for number data (quantitative data) and will find the mode when there is a single mode.
5) (04:18) If distribution is symmetrical Mean = Median = Mode.
6) (04:31) PivotTable and Sort feature to find the Mode for Categorical Data.
7) (06:29) MODE.MULT Array Function for number data (quantitative data) when there are multiple modes. This is an Array Function that requires the special key stroke: Ctrl + Shift + Enter. See Two Examples.
Download Excel File Not: After clicking on link, Use Ctrl + F (Find) and search for “Highline BI 348 Class” or for the file name as seen at the beginning of the video.
 0:09:04
Basic Excel Business Analytics #21: AVERAGE, MEDIAN, MODE.MULT functions & PivotTable Mode
 0:21:39
Basic Excel Business Analytics #13: Excel Data Analysis Features: Sort, Filter, Pivot Tables
 0:09:50
Basic Excel Business Analytics #11: Dynamic Grading Model: Excel Table feature & VLOOKUP
 0:06:16
Basic Excel Business Analytics #36: Power Query to Unpivot Data (Multiple Columns to Single Column)
 0:05:14
Basic Excel Business Analytics #30: Excel 2016 Power Query: Data Ribbon Tab, Get and Transform
 1:01:05
Basic Excel Business Analytics #42: Comprehensive PowerPivot, Data Model, DAX & Reporting Exampl...
 0:13:30
Basic Excel Business Analytics #14: Logical Formulas & Conditional Formatting to Visualizing Dat...
 0:21:39
How Business Analysts Use Excel - Business Analysis Software Tutorial
 0:19:40
Data Visualization in Python using Matplotlib
 0:06:52
Basic Excel Business Analytics #37: Excel 2016 Data Tab, Get & Transform: Unpivot feature
 0:13:59
Basic Excel Business Analytics #24: Empirical Rule, Calculating Probability NORM.DIST & NORM.S.D...
 0:16:30
Basic Excel Business Analytics #19: Why PivotTables Rule for Frequency Distributions & Histogram...
 0:00:40
How much does a TAX ANALYST make?
 0:05:01
Basic Excel Business Analytics #34: Power Query: Import & Merge Multiple Sources Access, Text, E...
 0:18:21
Basic Excel Business Analytics #23: Variability: Variance, Standard Deviation, Z-score and more
 0:09:34
Basic Excel Business Analytics #18: Data Analysis Add-in for Frequency Distribution & Histogram
 0:03:01
Basic Excel Business Analytics #35: Power Query to Get Data From Web Site & Import into Excel.
 0:13:17
Basic Excel Business Analytics #25: Percentiles, Quartiles, 5 Number Summary using Excel Functions
 0:03:19
Basic Excel Business Analytics #20: Skew: Shape of Histogram, Shape of Quantitative Data
 0:00:37
The Regrets of An Accounting Major @zoeunlimited
 0:00:44
Ashneer grover Controversial View on 75% College Attendance Rule
 0:42:30
Business Analytics with Excel | Data Science Tutorial | Simplilearn
 0:41:39
Basic Excel Business Analytics #43: Visualizing Data: Table & Chart Guidelines
 0:00:59
Excel Quick Tips - Insert Row / Column Shortcut with No Mouse #excel #exceltips #analytics
Комментарии