filmov
tv
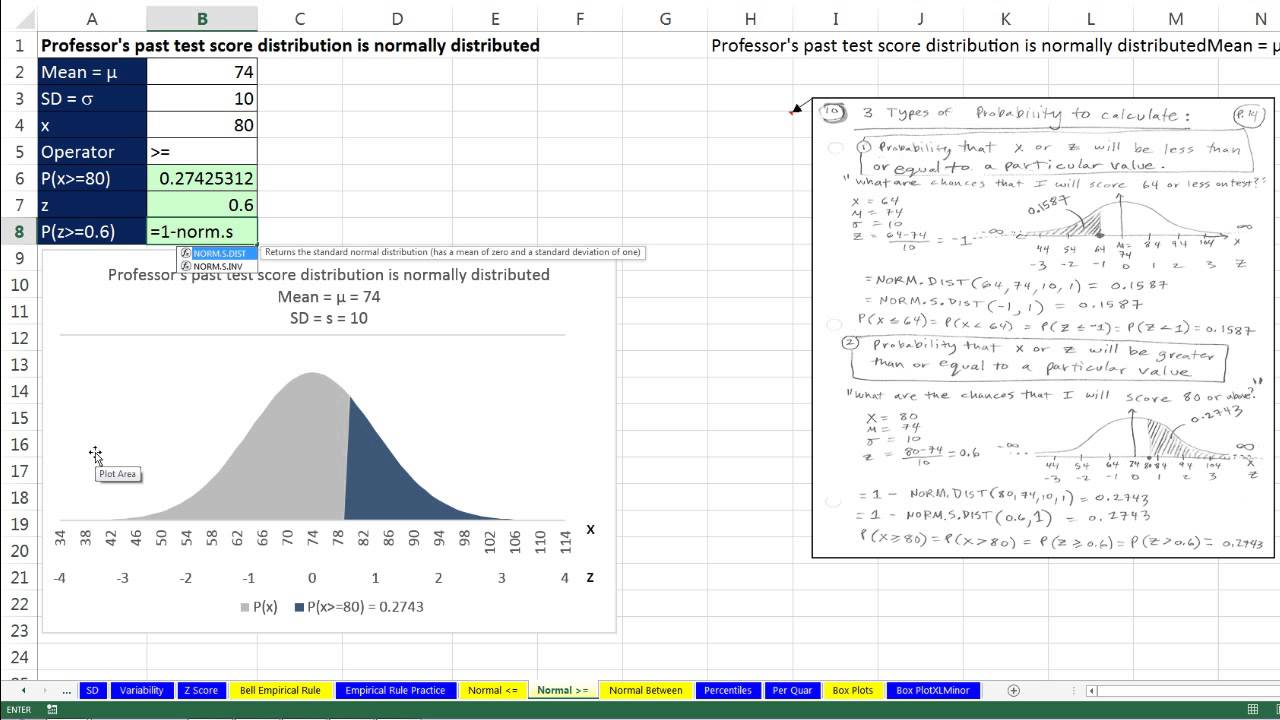
Basic Excel Business Analytics #24: Empirical Rule, Calculating Probability NORM.DIST & NORM.S.DIST
Показать описание
Learn How to use the Excel Normal Distribution Functions to calculate Probabilities for distributions that have a symmetrical or near symmetrical distribution. Learn how to use the NORM.DIST function, calculate z-score and use the NORM.S.DIST function:
1) (00:11) Empirical Rule
2) (01:06) calculate the probability of getting a particular value or less with NORM.DIST and NORM.S.DIST functions.
3) (04:58) Calculate the probability of getting a particular value or more with NORM.DIST and NORM.S.DIST functions.
4) (06:48) Calculate the probability of getting a particular value between an upper and lower number with NORM.DIST and NORM.S.DIST functions.
5) (09:23) Seattle Gas Price example for calculating probabilities with the Normal Curve and the functions NORM.DIST and NORM.S.DIST.
Download Excel File Not: After clicking on link, Use Ctrl + F (Find) and search for “Highline BI 348 Class” or for the file name as seen at the beginning of the video.
 0:13:59
Basic Excel Business Analytics #24: Empirical Rule, Calculating Probability NORM.DIST & NORM.S.D...
 0:18:29
Basic Excel Business Analytics #46: Slope & Intercept for Estimated Simple Liner Regression Equa...
 0:21:39
Basic Excel Business Analytics #13: Excel Data Analysis Features: Sort, Filter, Pivot Tables
 0:22:42
Basic Excel Business Analytics #65: Create Random Variables: Custom, Binomial, Uniform, Normal
 0:54:55
Excel for Beginners - The Complete Course
 0:13:17
Basic Excel Business Analytics #25: Percentiles, Quartiles, 5 Number Summary using Excel Functions
 1:01:05
Basic Excel Business Analytics #42: Comprehensive PowerPivot, Data Model, DAX & Reporting Exampl...
 0:11:33
Basic Excel Business Analytics 22 Geometric Mean Average Compounding Rate GEOMEAN RRI Function
 0:48:28
Project 4B: Furniture Mart Inventory and Product Analytics(R,tidyverse,chatgpt4o)
 0:18:21
Basic Excel Business Analytics #23: Variability: Variance, Standard Deviation, Z-score and more
 0:12:55
Basic Excel Business Analytics #60: Excel Solver: Minimize Transportation Costs, Integer Variable
 0:41:39
Basic Excel Business Analytics #43: Visualizing Data: Table & Chart Guidelines
 0:09:34
Basic Excel Business Analytics #18: Data Analysis Add-in for Frequency Distribution & Histogram
 0:00:16
Scope of Digital Marketing in 2024 | Digital Marketing Institute in Faridabad | Gourav Digital Club
 0:13:30
Basic Excel Business Analytics #14: Logical Formulas & Conditional Formatting to Visualizing Dat...
 0:16:57
Learn SQL Basics in Just 15 Minutes!
 0:00:31
Data Analytics 3 months roadmap #dataanalytics #datascience #upgradeskill #livetraining
 0:12:07
Basic Excel Business Analytics #31: Power Query: Import Multiple Excel Files with 1 Sheet Each
 0:11:52
Basic Excel Business Analytics #15: Count Transactions by Web Site Report & Chart
 0:00:11
11 years later ❤️ @shrads
 0:52:40
Excel Formulas and Functions | Full Course
 0:05:22
Basic Excel Business Analytics #26: Box & Whisker Plot. Chart Example in Excel 2016.
 0:00:16
How to eat Roti #SSB #SSB Preparation #Defence #Army #Best Defence Academy #OLQ
 0:23:02
Basic Excel Business Analytics #17: FREQUENCY Array Function for Frequency Distribution & Histog...
Комментарии