filmov
tv
A beginner's guide to reading a candlestick chart

Показать описание
All you need to know to start reading a candlestick trading chart.
Timestamps
0:00 - How to read a candlestick trading chart
0:20 - What are candlesticks?
0:33 - The basics of candlesticks
0:51 - Understanding candlesticks
1:48 - A look at a Binance candlestick chart
2:26 - Reading candlesticks on a Binance chart
Social
Disclaimer
All opinions and actions expressed and undertaken by the host are individual opinions and actions only and do not reflect the opinions and actions of Binance. #Binance cannot and does not guarantee the accuracy, applicability, reliability, integrity, performance or appropriateness of the content of this video, nor shall Binance be liable for any loss or damage that may be caused directly or indirectly by your use of these contents.
Binance is not your broker, intermediary, agent, or advisor and has no fiduciary relationship or obligation to you in connection with any trades or other decisions or activities effected by you. No communication or information provided to you by Binance is intended as, or shall be considered or construed as, investment advice, financial advice, trading advice, or any other sort of advice.
Binance does not recommend that any digital asset should be bought, earned, sold, or held by you. Before making the decision to buy, sell or hold any digital asset, you should conduct your own due diligence and consult your financial advisors prior to making any investment decision. Binance will not be held responsible for the decisions you make to buy, sell, or hold digital asset.
 0:38:04
Where to start with classic literature & tips for beginners 📒 How to start reading classics
 0:15:57
Astrology for Beginners: How to Read a Birth Chart 🌝
 0:18:50
Ultimate Beginner's Guide to Fantasy | 25+ Best Books For Every Reader
 0:12:19
Beginners Guide to the Bible | What you need to know + Tips for Reading!
 0:10:27
How to READ the BIBLE for BEGINNERS | 7 tips you need to know
 0:10:53
How To Read Stock Charts For Beginners
 0:14:15
a beginner's guide to ✨spiritual stuff✨ (manifesting, crystals, tarot + more)
 0:14:30
reading Stephen King | a beginners guide
 0:03:48
How to Find any item from PIN with Visual Pinterest Search 2024
 0:16:20
12 EASY! classic literature books for ACTUAL beginners (where to start)
 0:12:03
Tarot for Beginners: How I Use Tarot Cards for Self Discovery & Guidance
 0:16:25
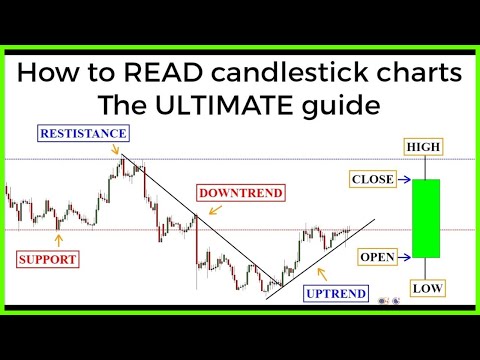
Candlestick charts: The ULTIMATE beginners guide to reading a candlestick chart
 0:08:12
5 Books To Read To Improve Basic English (For Beginners)
 0:17:13
A Beginner's Guide to Technical Analysis (pt. 1)
 0:08:40
A Beginner's Guide to Music Theory
 1:17:35
The Only Technical Analysis Video You Will Ever Need... (Full Course: Beginner To Advanced)
 0:09:30
How to Use a MULTIMETER - Beginners Guide (Measuring Volts, resistance, continuity & Amps)
 0:15:23
How to read the Bible (For Beginners) - Most Frequently Asked Question! | Rica Peralejo - Bonifacio
 0:19:02
Fish Finder 101: The Ultimate Guide for Beginners to Catch More Fish!
 0:13:19
How to read a Sewing Pattern for Beginners - Creating your first sewing pattern!
 0:22:14
40K BOOKS - WHERE TO START? A COMPLETE BEGINNERS GUIDE | Warhammer 40,000 Lore Discuss
 0:16:18
How to Read Construction Drawings | Beginners Guide to Blueprint Reading | Architectural Drawings
 0:13:58
Learn To Read As An Adult: 5 Steps For Beginners - Free Lessons Included | Learn Reading
 0:09:53
JOURNALING FOR BEGINNERS ✨» Easy + Effortless 'How To' Guide for Starting A Journal Today...
Комментарии