filmov
tv
Excel 2013 Statistical Analysis #12: Cross Tabulation & Charts For Two Variables, Simpson’s Paradox
Показать описание
Cross Tabulation & Charts For Two Variables, Simpsons Paradox
Topics in this video shows how to create Cross Tabulated Tables, Clustered Column Chart, Stacked Column Chart,100% Stacked Column Chart with PivotTables:
1. (00:09) Explain meaning and uses for Cross Tabulation Tables, Clustered Column Chart, Stacked Column Chart and 100% Stacked Column Chart
2. (04:02) Use PivotTable to create Cross Tabulated Table for a Categorical and Quantitative Variable (Age and Payment Method for a Sales transaction)
3. (04:17) Group Whole Number (age)
4. (06:22) Column Chart Options in Excel
5. (06:48) Clustered Column Chart to emphasize variable in Legend (Payment Method)
6. (08:27) Stacked Column Chart to emphasize variable in Horizontal Axis (Grouped Age Category)
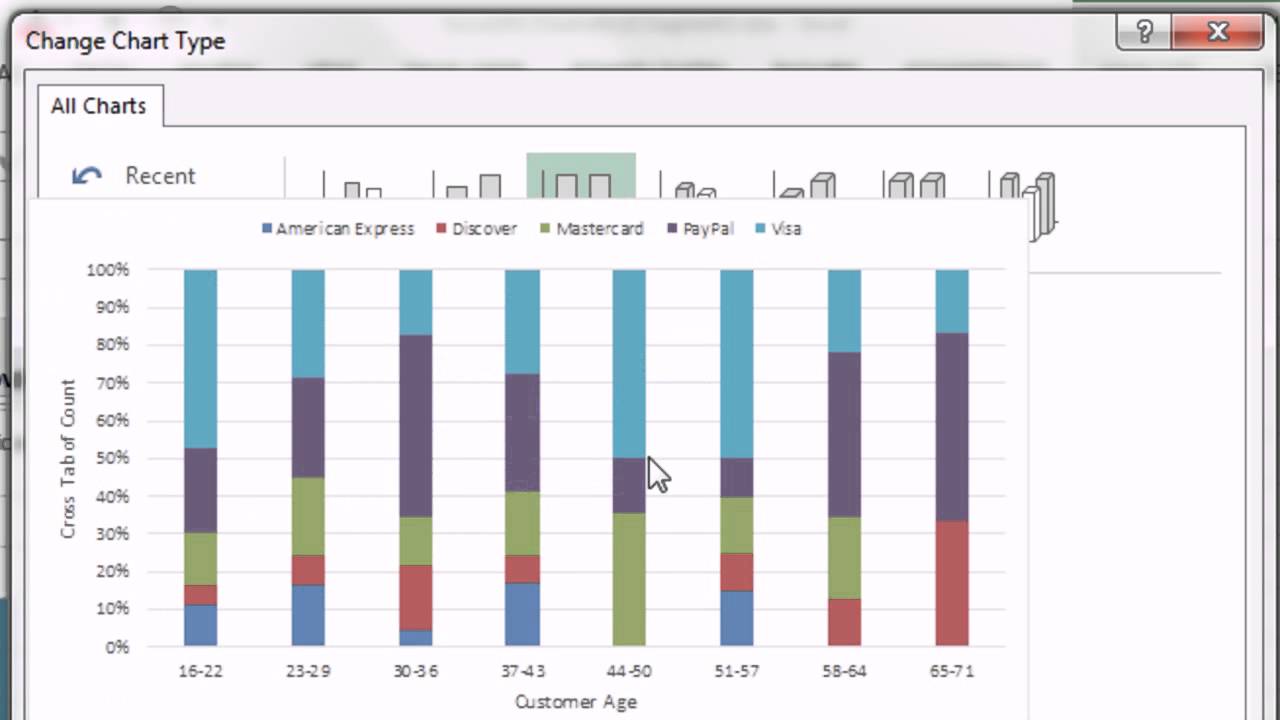
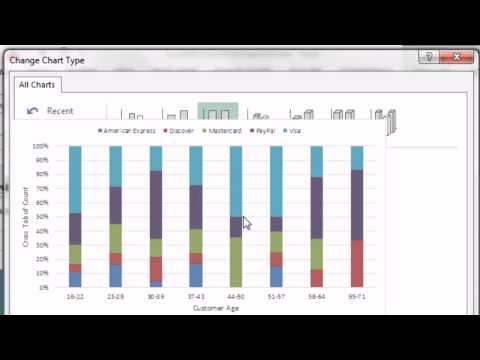
7. (09:14) 100% Stacked Column Chart to emphasize the percentages.
8. (10:00) Use PivotTable to create Cross Tabulated Table for Two Categorical Variables and see that Cross Tabulation are actually a three-in-one table that show: 1) Cross Tab, 2) Frequency Distribution for the Row Variable and 3) Frequency Distribution for the Column Variable
9. (12:10) Simpson’s Paradox: Revealing a Hidden Variable in two sub-Cross Tabulation PivotTables may show a reverse conclusion as compared to the aggregated Cross Tabulation.
Topics in this video shows how to create Cross Tabulated Tables, Clustered Column Chart, Stacked Column Chart,100% Stacked Column Chart with PivotTables:
1. (00:09) Explain meaning and uses for Cross Tabulation Tables, Clustered Column Chart, Stacked Column Chart and 100% Stacked Column Chart
2. (04:02) Use PivotTable to create Cross Tabulated Table for a Categorical and Quantitative Variable (Age and Payment Method for a Sales transaction)
3. (04:17) Group Whole Number (age)
4. (06:22) Column Chart Options in Excel
5. (06:48) Clustered Column Chart to emphasize variable in Legend (Payment Method)
6. (08:27) Stacked Column Chart to emphasize variable in Horizontal Axis (Grouped Age Category)
7. (09:14) 100% Stacked Column Chart to emphasize the percentages.
8. (10:00) Use PivotTable to create Cross Tabulated Table for Two Categorical Variables and see that Cross Tabulation are actually a three-in-one table that show: 1) Cross Tab, 2) Frequency Distribution for the Row Variable and 3) Frequency Distribution for the Column Variable
9. (12:10) Simpson’s Paradox: Revealing a Hidden Variable in two sub-Cross Tabulation PivotTables may show a reverse conclusion as compared to the aggregated Cross Tabulation.
 0:18:37
Excel 2013 Statistical Analysis #12: Cross Tabulation & Charts For Two Variables, Simpson’s Para...
 0:25:27
Excel 2013 Statistical Analysis #27: Adding Law of Probability for OR Events (12 Examples)
 0:11:49
Excel 2013 Statistical Analysis #17: Weighted Mean & SUMPRODUCT Function & Accounting Exampl...
 2:22:43
Excel 2013 Statistical Analysis #01: Using Excel Efficiently For Statistical Analysis (100 Examples)
 0:13:05
Excel 2013 Statistical Analysis #14: VLOOKUP to Add New Field To Table & Create Cross Tabulation
 0:26:57
Excel 2013 Statistical Analysis #43: Simple Random Sampling in Excel: Process & Theory
 0:11:04
Excel 2013 Statistical Analysis #45: Sampling Distribution of Pbar (Binomial Sample Proportion)
 0:41:36
Excel 2013 Statistical Analysis #8: Frequency Distributions, Histograms, Skew, Quantitative Variable
 0:16:05
ATS Friendly Resume for Data Analyst Fresher | Best CV Format 2024 | CV Format for Job
 0:07:22
Excel 2013 Statistical Analysis #13: Scatter Chart & Trendline, X Y Data, 2 Quantitative Variabl...
 0:15:48
Excel 2013 Statistical Analysis #09: Cumulative Frequency Distribution & Chart, PivotTable &...
 0:09:01
Excel 2013 Statistical Analysis #37: Introduction to Continuous Probability Distributions
 0:07:01
Excel 2013 Statistical Analysis #52: Determine Sample Size for Sample Mean & Sample Proportion
 0:09:02
Excel 2013 Statistical Analysis #11: Power Query Import Multiple Text Files, Grade Histogram by Year
 0:33:18
Excel 2013 Statistical Analysis #28: Multiplication Law of Probability AND Events (16 Examples)
 0:19:22
Excel 2013 Statistical Analysis #24: Numerical Measures: Covariance and Correlation Coefficient
 0:31:07
Excel 2013 Statistical Analysis #25: Probability Basics: Sample Points, Events & Event Probabili...
 0:07:02
Excel 2013 Statistical Analysis #15: Create Dot Plot in Excel Using COUNTIFS and REPT functions
 0:30:11
Excel 2013 Statistical Analysis #72: Chi-Square Test For 2 or More Population Proportions (Formulas)
 0:24:16
Excel 2013 Statistical Analysis #70: Sampling Distribution of Pbar1 – Pbar2, Mean & Standard Err...
 0:23:45
Excel 2013 Statistical Analysis #34: POSSION Distribution and POISSON.DIST Function
 0:14:29
Excel 2013 Statistical Analysis #62: Calculate Slope and Intercept for Regression Line
 0:37:51
Excel 2013 Statistical Analysis #33: Binomial Probability Distributions: Tables, Charts, Functions
 0:16:40
Excel 2013 Statistical Analysis #30: Bayes’ Theorem to Calculate Posterior Probabilities
Комментарии