filmov
tv
Excel 2013 Statistical Analysis #8: Frequency Distributions, Histograms, Skew, Quantitative Variable
Показать описание
Topics in this video:
1. (00:09) Overview of Frequency Distributions for Quantitative Variable
2. (02:02) Create Frequency Distribution with PivotTable for Grade Data where NUMBERS ARE DECIMALS (important distinction for grouping feature in a PivotTable)
3. (03:08) Grouping Feature in a PivotTable for creating Classes or Categories for a Decimal Quantitative Variable. Class that are created are 0-10, 10-20, 20-30, etc. Extensive Discussion about how to create classes or categories that are NOT Ambiguous.
4. (05:03) Upper Limit for Class/Category is Not Included when the numbers are Decimals.
5. (05:58) Aggregate Function for Number Values defaults to Count when you have Grouped Numbers in the Row area of the PivotTable.
6. (06:32) Double Click PivotTable to Extract Records that match the criteria from the Row area of the PivotTable
7. (09:16) Use Find and Replace feature to create non-ambiguous labels in a Grouped Decimal Number PivotTable.
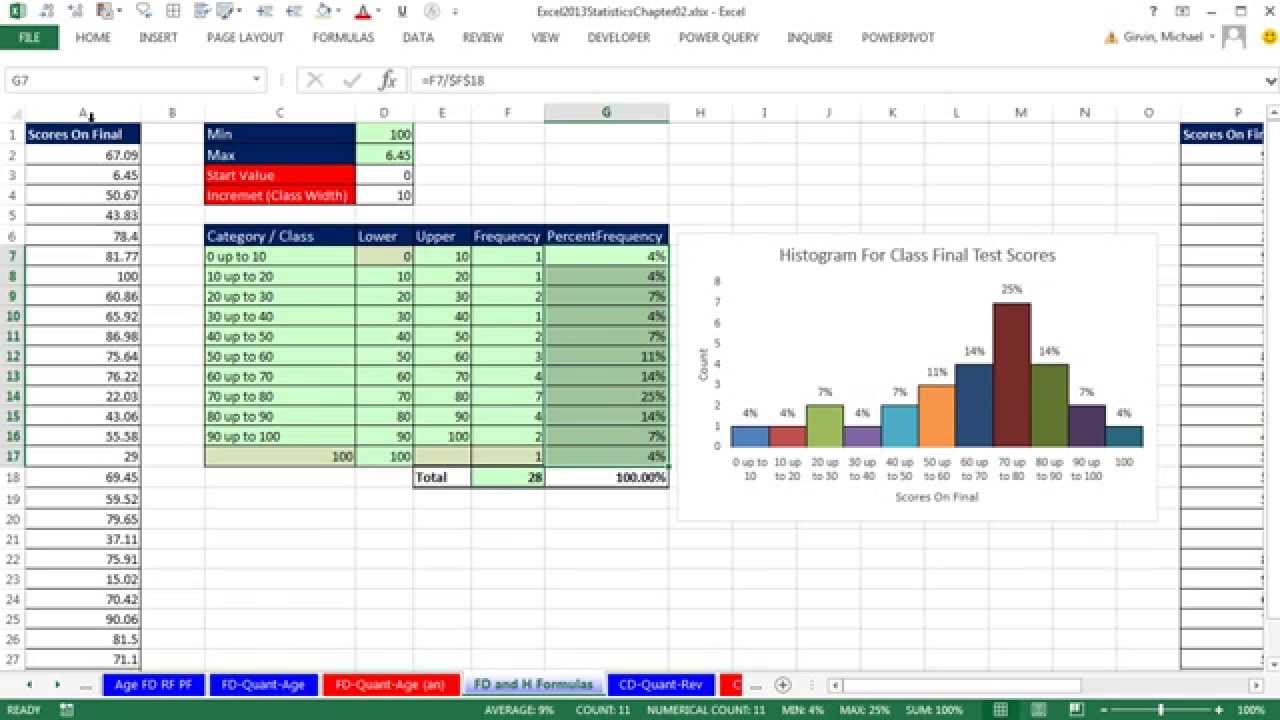
8. (10:20) Create Histogram for Quantitative Variable (Grouped Numbers) for Grade Data. This Histogram has Frequencies at the top of each column and the gap width is zero. The colors for each column are different.
9. (13:13) Create Frequency Distribution with PivotTable for Grade Data where numbers are WHOLE NUMBERS (important distinction for grouping feature in a PivotTable)
10. (14:33) Methods for determining Number of Classes and Class Width for a Quantitative Variable
11. (18:19) When grouping Whole Numbers in a PivotTable the classes that are created are not ambiguous. We get classes like: 16-22, 23-29, 30-36. Etc.
12. (20:07) Create Histogram for Quantitative Variable (Grouped Numbers) for Age Data. This Histogram has Frequencies in the vertical axis and the gap width is zero. The colors for each column are the same.
13. (22:00) Discussion about Skew, Histogram shape and Histogram distribution of column heights.
14. (25:37) Relative Frequency and Percent Frequency Distribution built with a PivotTable based on Age Data that is shown as a Whole Number.
15. (27:48) Formulas
16. (27:44) Create Frequency Distribution with Formulas for Grade Data.
17. (30:03) Text Formulas for Category Labels
18. (30:40) COUNTIFS function with Comparative Operators Joined to Lower and Upper Limits from the Cells.
19. (33:17) Relative/Percent Frequency Formula.
20. (34:00) Create Histogram for Grade Data based on Frequency Distribution created with formulas.
21. (35:56) See that we can change the categories be more precise when we use formulas.
22. (38:20) Link Data Labels in Chart to cells in the spreadsheet
23. (39:16) See how formulas allow Frequency Distribution Formulas and Histogram Chart update automatically when raw data change. See different grade distributions with Histogram.
24. (40:45) Summary
1. (00:09) Overview of Frequency Distributions for Quantitative Variable
2. (02:02) Create Frequency Distribution with PivotTable for Grade Data where NUMBERS ARE DECIMALS (important distinction for grouping feature in a PivotTable)
3. (03:08) Grouping Feature in a PivotTable for creating Classes or Categories for a Decimal Quantitative Variable. Class that are created are 0-10, 10-20, 20-30, etc. Extensive Discussion about how to create classes or categories that are NOT Ambiguous.
4. (05:03) Upper Limit for Class/Category is Not Included when the numbers are Decimals.
5. (05:58) Aggregate Function for Number Values defaults to Count when you have Grouped Numbers in the Row area of the PivotTable.
6. (06:32) Double Click PivotTable to Extract Records that match the criteria from the Row area of the PivotTable
7. (09:16) Use Find and Replace feature to create non-ambiguous labels in a Grouped Decimal Number PivotTable.
8. (10:20) Create Histogram for Quantitative Variable (Grouped Numbers) for Grade Data. This Histogram has Frequencies at the top of each column and the gap width is zero. The colors for each column are different.
9. (13:13) Create Frequency Distribution with PivotTable for Grade Data where numbers are WHOLE NUMBERS (important distinction for grouping feature in a PivotTable)
10. (14:33) Methods for determining Number of Classes and Class Width for a Quantitative Variable
11. (18:19) When grouping Whole Numbers in a PivotTable the classes that are created are not ambiguous. We get classes like: 16-22, 23-29, 30-36. Etc.
12. (20:07) Create Histogram for Quantitative Variable (Grouped Numbers) for Age Data. This Histogram has Frequencies in the vertical axis and the gap width is zero. The colors for each column are the same.
13. (22:00) Discussion about Skew, Histogram shape and Histogram distribution of column heights.
14. (25:37) Relative Frequency and Percent Frequency Distribution built with a PivotTable based on Age Data that is shown as a Whole Number.
15. (27:48) Formulas
16. (27:44) Create Frequency Distribution with Formulas for Grade Data.
17. (30:03) Text Formulas for Category Labels
18. (30:40) COUNTIFS function with Comparative Operators Joined to Lower and Upper Limits from the Cells.
19. (33:17) Relative/Percent Frequency Formula.
20. (34:00) Create Histogram for Grade Data based on Frequency Distribution created with formulas.
21. (35:56) See that we can change the categories be more precise when we use formulas.
22. (38:20) Link Data Labels in Chart to cells in the spreadsheet
23. (39:16) See how formulas allow Frequency Distribution Formulas and Histogram Chart update automatically when raw data change. See different grade distributions with Histogram.
24. (40:45) Summary
 0:41:36
Excel 2013 Statistical Analysis #8: Frequency Distributions, Histograms, Skew, Quantitative Variable
 0:07:02
Excel 2013 Statistical Analysis #15: Create Dot Plot in Excel Using COUNTIFS and REPT functions
 0:37:51
Excel 2013 Statistical Analysis #33: Binomial Probability Distributions: Tables, Charts, Functions
 0:15:48
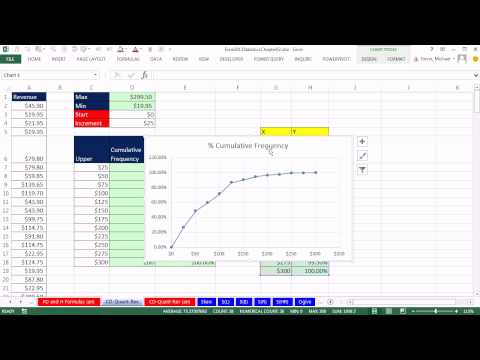
Excel 2013 Statistical Analysis #09: Cumulative Frequency Distribution & Chart, PivotTable &...
 0:30:11
Excel 2013 Statistical Analysis #72: Chi-Square Test For 2 or More Population Proportions (Formulas)
 0:32:08
Excel 2013 Statistical Analysis #31: Create Discrete Probability Distribution, Calculate Mean and SD
 0:19:41
Excel 2013 Statistical Analysis #36: Dynamic Binomial Probability Charts (3 Examples)
 0:20:17
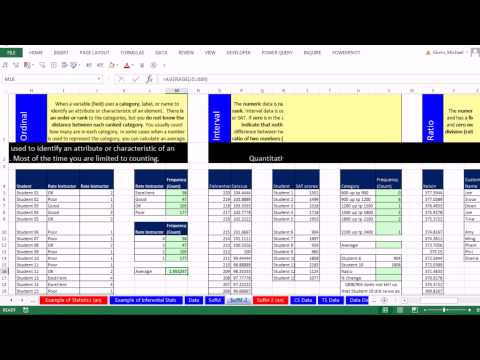
Excel 2013 Statistical Analysis #5 Data Categorical, Quantitative, Nominal, Ordinal, Interval, Ratio
 0:02:18
Master EXCEL with WORKDAY FUNCTION Secrets | Raj Singh Microsoft Certified Trainer
 0:03:26
Excel 2013 Statistical Analysis #07: Subtle Chart Junk
 0:33:32
Excel 2013 Statistical Analysis #06: Frequency Distributions & Column Charts, Categorical Variab...
 2:22:43
Excel 2013 Statistical Analysis #01: Using Excel Efficiently For Statistical Analysis (100 Examples)
 0:28:04
Excel 2013 Statistical Analysis #71: Inference About Difference Between 2 Pop. Proportions Z Method
 0:13:05
Excel 2013 Statistical Analysis #14: VLOOKUP to Add New Field To Table & Create Cross Tabulation
 0:02:48
Excel 2013 Statistical Analysis #10: Description of Dot Plot and Stem and Leaf Charts
 0:29:59
Excel 2013 Statistical Analysis #20: Standard Deviation: How Fairly Does Mean Represent Data Points?
 0:24:16
Excel 2013 Statistical Analysis #70: Sampling Distribution of Pbar1 – Pbar2, Mean & Standard Err...
 0:41:11
Excel 2013 PivotTables & Charts for Descriptive Statistics From Raw Data Sets (5 Examples) Math ...
 0:23:45
Excel 2013 Statistical Analysis #34: POSSION Distribution and POISSON.DIST Function
 0:08:39
Excel 2013 Statistical Analysis #41: Answering Probability Questions With NORM.DIST Function
 0:09:01
Excel 2013 Statistical Analysis #37: Introduction to Continuous Probability Distributions
 0:20:55
Excel 2013 Statistical Analysis #19: Location: Percentile, Quartile, Rank and Percentile Rank
 0:02:08
Excel 2013 Statistical Analysis #00: Excel Workbooks For This Class
 0:11:04
Excel 2013 Statistical Analysis #45: Sampling Distribution of Pbar (Binomial Sample Proportion)
Комментарии