filmov
tv
Analyzing Quantitative PCR Data

Показать описание
Relative and absolute methods of qPCR analysis. Created for an assignment for BIOC3001: Molecular Biology at the University of Western Australia.
****SCRIPT**** [I know it's a bit fast]
qPCR or quantitative real-time PCR…
….is simply classic PCR monitored using fluorescent dyes or probes.
qPCR is accurate, reliable and extremely sensitive, it can even detect a SINGLE copy of a specific transcript.
qPCR is commonly coupled to reverse transcription to measure gene expression.
No wonder it is so important for molecular diagnostics, life sciences, agriculture, and medicine.
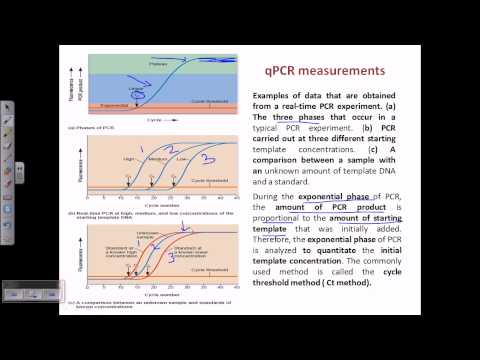
Firstly, let's go over the NUTS and BOLTS of qPCR. For this you use a fluorescent dye which binds to the DNA. As qPCR progresses, the fluorescent signal increases.
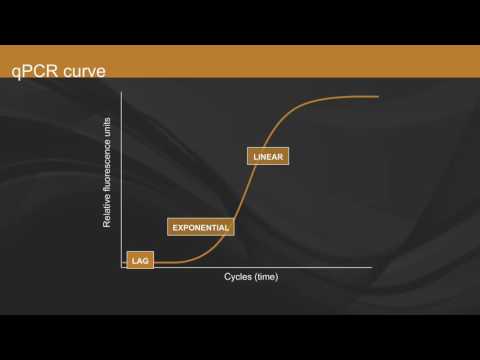
Ideally the signal should double with every cycle, which is then plotted.
Because there are few template strands to start with, initially there’s a faint signal.
Eventually, usually after 15 cycles, the signal rises above the background noise and can be detected. We call this the THRESHOLD CYCLE, Ct, the point from which all quantitative data analysis begins.
But how do you analyse qPCR data?
You can either use an absolute quantification method, with a standard curve, OR a relative method, using one or more reference genes to standardize and compare the differences in Ct values between two treatments.
The absolute standard curve method determines ORIGINAL DNA concentration by comparing the Ct value of the sample of interest with a standard curve.
To create the standard curve, you need to make DNA samples of different KNOWN concentrations.
After doing PCR on these, you will see different PCR plots for each standard …..
and unsurprisingly they have different Ct values. The GREATER the concentration of the original DNA sample, the SMALLER the Ct value.
So if you plot ORIGINAL DNA concentration against the Ct values. You will have a standard curve like this…..
Now let’s say the PCR plot of your unknown DNA sample is somewhere here…..
...which corresponds to this Ct value on the standard curve here….
Using the standard curve you can figure out the log concentration of your DNA sample to be x.
As this is in log scale, you can simply calculate your sample DNA concentration to be 10 to the power of x.
Absolute analysis is suitable when you want to determine the ACTUAL transcript copy number, that is the level of gene expression.
On the other hand, Relative quantification is used when you want to COMPARE the difference in gene expression BETWEEN two treatments, for example light or dark treated Arabadopsis thaliana.
This is done using one or more reference genes, such as actin, which are expressed at the SAME level for both treatments.
You then perform qPCR on both your samples and the reference genes, find out the DIFFERENCE between the two Cts values, delta Ct, in EACH treatment.
Now the RATIO of the two delta Cts …[pause a bit] . tells you how much gene expression has changed.
For instance, in the dark treatment, the Ct value of your reference gene is at THIS level, the Ct value of your target gene is THIS Level. So you have this delta Ct which is the difference in Cts in the first treatment.
in the dark treatment, the Ct value of your reference gene is STILL at THIS level, but the Ct value of your target gene may become only this much.
So the ratio of the two Ct values is..
delta Ct(dark treatment) divided by delta Ct(light treament) equals one third
….showing the delta Ct has DECREASED by a factor of 3, which means that gene expression of the target gene is GREATER in the dark treated sample.
This is how relative quantification using a reference gene helps detect change in the expression of your target gene.
In conclusion, there are two ways to quantify transcripts using qPCR: absolute quantification using a standard curve, and relative quantification using a reference gene.
The method used depends on whether you want to determine the ACTUAL number of transcripts or the RELATIVE change in gene expression.
****SCRIPT**** [I know it's a bit fast]
qPCR or quantitative real-time PCR…
….is simply classic PCR monitored using fluorescent dyes or probes.
qPCR is accurate, reliable and extremely sensitive, it can even detect a SINGLE copy of a specific transcript.
qPCR is commonly coupled to reverse transcription to measure gene expression.
No wonder it is so important for molecular diagnostics, life sciences, agriculture, and medicine.
Firstly, let's go over the NUTS and BOLTS of qPCR. For this you use a fluorescent dye which binds to the DNA. As qPCR progresses, the fluorescent signal increases.
Ideally the signal should double with every cycle, which is then plotted.
Because there are few template strands to start with, initially there’s a faint signal.
Eventually, usually after 15 cycles, the signal rises above the background noise and can be detected. We call this the THRESHOLD CYCLE, Ct, the point from which all quantitative data analysis begins.
But how do you analyse qPCR data?
You can either use an absolute quantification method, with a standard curve, OR a relative method, using one or more reference genes to standardize and compare the differences in Ct values between two treatments.
The absolute standard curve method determines ORIGINAL DNA concentration by comparing the Ct value of the sample of interest with a standard curve.
To create the standard curve, you need to make DNA samples of different KNOWN concentrations.
After doing PCR on these, you will see different PCR plots for each standard …..
and unsurprisingly they have different Ct values. The GREATER the concentration of the original DNA sample, the SMALLER the Ct value.
So if you plot ORIGINAL DNA concentration against the Ct values. You will have a standard curve like this…..
Now let’s say the PCR plot of your unknown DNA sample is somewhere here…..
...which corresponds to this Ct value on the standard curve here….
Using the standard curve you can figure out the log concentration of your DNA sample to be x.
As this is in log scale, you can simply calculate your sample DNA concentration to be 10 to the power of x.
Absolute analysis is suitable when you want to determine the ACTUAL transcript copy number, that is the level of gene expression.
On the other hand, Relative quantification is used when you want to COMPARE the difference in gene expression BETWEEN two treatments, for example light or dark treated Arabadopsis thaliana.
This is done using one or more reference genes, such as actin, which are expressed at the SAME level for both treatments.
You then perform qPCR on both your samples and the reference genes, find out the DIFFERENCE between the two Cts values, delta Ct, in EACH treatment.
Now the RATIO of the two delta Cts …[pause a bit] . tells you how much gene expression has changed.
For instance, in the dark treatment, the Ct value of your reference gene is at THIS level, the Ct value of your target gene is THIS Level. So you have this delta Ct which is the difference in Cts in the first treatment.
in the dark treatment, the Ct value of your reference gene is STILL at THIS level, but the Ct value of your target gene may become only this much.
So the ratio of the two Ct values is..
delta Ct(dark treatment) divided by delta Ct(light treament) equals one third
….showing the delta Ct has DECREASED by a factor of 3, which means that gene expression of the target gene is GREATER in the dark treated sample.
This is how relative quantification using a reference gene helps detect change in the expression of your target gene.
In conclusion, there are two ways to quantify transcripts using qPCR: absolute quantification using a standard curve, and relative quantification using a reference gene.
The method used depends on whether you want to determine the ACTUAL number of transcripts or the RELATIVE change in gene expression.
 0:03:25
Analyzing Quantitative PCR Data
 0:05:26
How to analyze real-time PCR data--Taq Talk Episode 10
 0:14:12
qPCR details | quantitative real time PCR | RT PCR | Biotechniques
 0:08:33
Quantitative real time PCR (qPCR)
 0:04:37
qPCR (real-time PCR) protocol explained
 0:08:27
How to Analyze Real time PCR Data? | Real Time PCR Gene Expression Fold Change Calculation
 0:15:28
qRT PCR calculation for beginners delta delta Ct method in Excel | Relative fold Change
 0:01:44
Real Time PCR - Interpretation of the amplification plot - part 2 HD
 0:32:48
Analyzing quantitative PCR data (& RealTime PCR in general) - practical example & explanatio...
 0:02:45
Overview of qPCR
 0:10:44
RT - PCR (Real Time PCR) | Quantitative - PCR | qPCR | Basic Principle and Data Analysis
 1:24:51
Real Time PCR - Part 3
 0:12:54
Quantitative real time PCR (qPCR)
 0:03:35
What are Ct values in real-time PCR?--Taq Talk Episode 3
 0:01:32
How to calculate Relative gene expression in qPCR using Delta Delta Ct method | Livak Method
 0:10:21
BE553 Topic V Tutorial qPCR relative analysis using 2–∆∆Ct
 0:05:10
Absolute quantification in real-time PCR--Taq Talk Episode 17
 0:03:43
Using Standard Curve to Estimate DNA Quantity - Forensic Focus #4
 0:09:26
Real Time PCR Analysis qPCR Terms
 0:08:47
qPCR Analysis with CFX Maestro™: Data Analysis
 0:09:19
Change CT values of qPCR data into Relative expression Graphs
 0:04:18
Digital PCR vs. Real-time PCR - Ask TaqMan #30
 0:06:52
How To Perform The Delta-Delta Ct Method (In Excel)
 0:58:07
Real-Time PCR in Action
Комментарии