filmov
tv
Magic JavaScript trio for Grafana | Dynamic Text, Data Manipulation and Apache ECharts plugins

Показать описание
Three plugins that make Grafana complete. Dynamic Text, Data Manipulation, and Apache ECharts are all you need to create functional real-world web applications.
LINKS FROM THE VIDEO
Plugin documentation, along with the blog posts, is here
CHAPTERS
0:00 Intro
0:47 JavaScript is the common ground for the magic trio plugins
1:01 Use case. Switching dashboard using a Grafana dashboard variable/filter
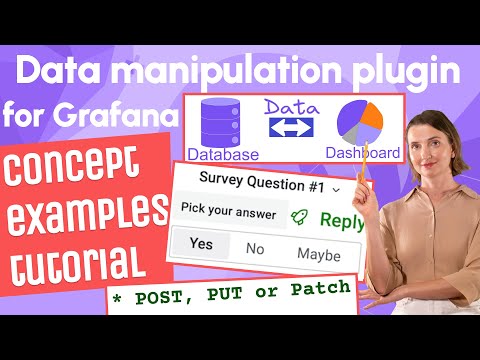
2:00 Data Manipulation
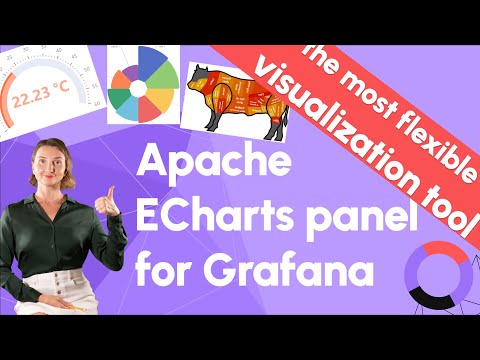
3:36 Apache ECharts
4:58 Dynamic Text
DISCOVER
GET IN TOUCH
#Grafana #GrafanaPlugins #Visualization #visualización
LINKS FROM THE VIDEO
Plugin documentation, along with the blog posts, is here
CHAPTERS
0:00 Intro
0:47 JavaScript is the common ground for the magic trio plugins
1:01 Use case. Switching dashboard using a Grafana dashboard variable/filter
2:00 Data Manipulation
3:36 Apache ECharts
4:58 Dynamic Text
DISCOVER
GET IN TOUCH
#Grafana #GrafanaPlugins #Visualization #visualización
 0:07:08
Magic JavaScript trio for Grafana | Dynamic Text, Data Manipulation and Apache ECharts plugins
 0:06:01
Prescient: How to Use HTML/CSS/JS in Grafana | Building Accordion Panel in Grafana
 0:05:56
JavaScript code in the Dynamic text panel | Grafana functionality explodes
 0:10:20
Dynamic Text plugin for Grafana | Use HTML, Markdown, JavaScript and CSS | Community use cases
 0:01:00
Apache ECharts panel 5.1.0 for Grafana #grafana #echarts #community #opensource
 0:10:19
Apache ECharts panel for Grafana | How to create modern dashboards in Grafana | ECharts Tutorial
 0:01:40
Manipulate Data using Grafana dashboard | API Node.js Server and Deno Deploy Project
 0:14:19
Data Manipulation for Grafana | Use REST API, Data Source and Queries to manipulate your data
 0:08:02
Dynamic Text Plugin for Grafana | Markdown, HTML and Handlebars to transform data visualizations
 0:01:39
Customize Grafana interface | Change titles, icons, footer, default dashboard | Grafana 9
 0:02:00
Use Data Source in Apache ECharts in 90 seconds | Grafana Data attribute
 0:04:11
Images, PDFs, Video, Live Camera Feed on Grafana Dashboard! You will need Base64 Image/PDF Plugin
 0:09:35
Data Manipulation Plugin for Grafana | Manual data entering and User input into Dashboard
 0:05:09
JSON Data Sources for Grafana | JSON API, Infinity, Simpod compared
 0:06:12
Tell the story with Grafana dashboard | Apache ECharts, Bar Chart, Logs, Heatmap tutorial
 0:04:39
IoT Framework based on balena and Grafana | Open source Grafana plugins
 0:17:23
echart bar
 0:13:03
Monitoring in Edge Flow Manager | Observability with Grafana
 0:09:26
test& echarts
 0:12:27
Histograms, Clustering. Regression in Apache ECharts panel for Grafana | ecStat library tutorial
 0:01:21
7 Best Free And Open Source Floor Plan Software Solutions
 0:12:44
Simple System Monitoring tools you caneasily run on your servers to get a quick view of resources.
 0:01:38
Render a directed graph using Apache ECharts in Grafana | Graph customization
 0:01:31
Static and dynamic interface elements of Data Manipulation plugin | DML using data source in Grafana
Комментарии