filmov
tv
Apache ECharts panel for Grafana | How to create modern dashboards in Grafana | ECharts Tutorial

Показать описание
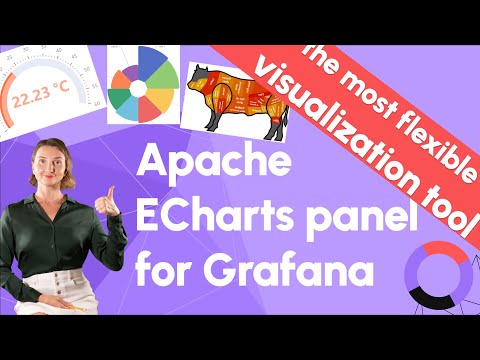
Apache ECharts is a mighty tool. You do not need a senior Javascript developer to start displaying modern-looking animated visualizations. And if your use case is unique, Apache ECharts provides an excellent venue to develop visualizations of any complexity.
The Apache ECharts panel for Grafana is a bridge that has been missing and finally arrived. You can use the benefits of two great open-source products - Grafana and Apache ECharts in one solution tailored to your needs. This video has all the details, along with the easy-to-follow tutorial.
CHAPTERS
0:00 Intro
0:31 Where does Grafana come from
0:45 Three major Grafana components
1:08 The excellent Grafana feature
2:07 Introducing Apache ECharts
2:42 Apache ECharts demo
4:45 How to Use Apache ECharts in Grafana - introducing ECharts Panel
4:51 Step 1
5:15 Step 2
05:21 Step 3
05:33 Step 4
05:55 Step 5
06:10 Step 6
06:41 First redo - Grafana bar chart into Apache ECharts bar
08:38 Second redo - Grafana clock into Apache ECharts clock
08:54 How to use an SVG picture
DISCOVER
GET IN TOUCH
#Grafana #GrafanaPlugins #Visualization #ApacheECharts #ECharts #visualización #cuadro
 0:11:54
Apache ECharts panel for Grafana | Explore possibilities
 0:10:19
Apache ECharts panel for Grafana | How to create modern dashboards in Grafana | ECharts Tutorial
 0:01:00
Apache ECharts panel 5.1.0 for Grafana #grafana #echarts #community #opensource
 0:12:27
Histograms, Clustering. Regression in Apache ECharts panel for Grafana | ecStat library tutorial
 0:02:00
Use Data Source in Apache ECharts in 90 seconds | Grafana Data attribute
 0:01:00
Business Charts powered by Apache ECharts for Grafana 6.0.0 #grafana #echarts #opensource
 0:06:36
Business Charts panel for Grafana 6.0.0 powered by Apache ECharts library | Visual Editor tutorial
 0:15:27
Build directed graph in Grafana using Apache ECharts | Tutorial part 1
 0:06:12
Tell the story with Grafana dashboard | Apache ECharts, Bar Chart, Logs, Heatmap tutorial
 0:18:56
JSON API and Infinity Data Source tutorial for Grafana | How to display the unemployment rate
 0:15:39
Build directed graph in Grafana using Apache ECharts | Tutorial part 2
 0:07:08
Magic JavaScript trio for Grafana | Dynamic Text, Data Manipulation and Apache ECharts plugins
 0:18:36
Step up your data visualization game with Apache ECharts
 0:01:19
Apache ECharts supports base64 PNG and SVG (vector) images | Prefixes for various types of pictures
 0:01:38
Render a directed graph using Apache ECharts in Grafana | Graph customization
 0:00:59
Data Manipulation panel 3.1.0 for Grafana #grafana #forms #community #opensource
 0:04:42
Apache ECharts in 5 minutes
 0:01:13
Apache ECharts.js add custom button and add custom SVG icon
 0:01:00
Data Manipulation 3.0.0 for Grafana #api #grafana #opensource #community
 0:09:23
Time Series panel overview | Grafana most popular plugin
 0:04:11
Images, PDFs, Video, Live Camera Feed on Grafana Dashboard! You will need Base64 Image/PDF Plugin
 0:09:26
test& echarts
 0:05:41
Static data source for Grafana | Mimic any data source tutorial
 0:04:39
IoT Framework based on balena and Grafana | Open source Grafana plugins
Комментарии