filmov
tv
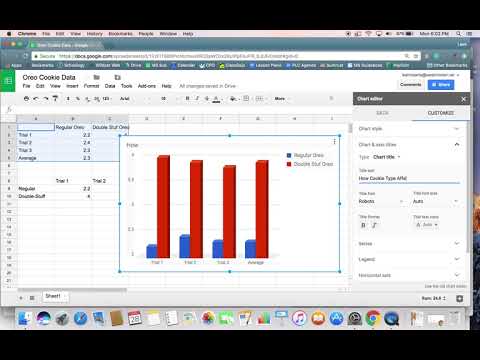
How to Create a Chart in Google Sheets to Analyze Google Forms Data | Tech Coach Weekly Ep10

Показать описание
Do you have data in a Google Form that you would like to analyze so you can create a Data Dashboard using Google Sheets?
In this episode of Tech Coach weekly, we will show you how to export your Google Forms data into a Google Sheets project and then walk you through the steps of creating a variety of Charts and Graphs so you can quickly see and analyze your data.
00:00 - Start
00:48 - How to Look at Google Forms Results Data
01:37 - Export Data into Google Sheets
02:11 - How to Create a NEW Google Sheet for your Data
02:56 - How to resize multiple Columns in Google Sheets
03:31 - How to Format Column Headers in Google Sheets
03:47 - How to add a Boarder in Google Sheets
04:21 - How to Create a Chart in Google Sheets
04:46 - How to Create a 3D Chart in Google Sheets
05:29 - How to Create a Bar Chart in Google Sheets
07:01 - Final Wrap-up and Review
VISIT TEACHERCAST TODAY
CHECK OUT MY MOST RECENT VIDEO
CHECK OUT MY MOST POPULAR VIDEO EVER!
CONNECT WITH ME ONLINE
#TeacherCast | #GoogleForms | #GoogleSheets
 0:24:31
Excel Charts and Graphs Tutorial
 0:00:53
Create Organization Chart in 2 Minutes | Power Point Tutorials
 0:01:34
How to Create a Graph in Excel
 0:00:53
How To Make A Chart In Google Sheets
 0:03:20
How to Make a Bar Graph in Excel
 0:14:10
Excel Charts & Graphs: Learn the Basics for a Quick Start
 0:00:20
Create a pie chart in Google Sheets
 0:02:40
How to create a Graph in Microsoft Word 2019 (2020 Tutorial)
 0:01:00
Make a Target Chart in Excel in 60 Seconds! 🎯📊
 0:03:16
How to Make a Pie Chart in Excel
 0:01:25
How to Make a Chart in Excel From Several Worksheets : Microsoft Excel Help
 0:00:33
How to create a pie chart using multiple measures in Tableau
 0:02:12
How to create a Column Chart in Excel
 0:05:14
Making a Simple Bar Graph in Excel
 0:07:52
How to make organizational chart in Microsoft Word
 0:05:13
How To Create A Pie Chart In Excel (With Percentages)
 0:05:51
How to insert a Column chart in Excel Tutorial
 0:01:22
Quickly create a chart and table in Excel by Chris Menard
 0:03:28
How to Create a Chart Comparing Two Sets of Data? | Excel | Tutorial
 0:07:03
How to Create a Graph in Google Sheets
 0:03:45
How to Create Charts in Microsoft Excel | Pie Chart in Excel | Line Chart in MS Excel
 0:03:31
How to Make Bar Chart Race Video | Tutorial
 0:00:36
How to create a pie chart
 0:01:23
How to Create Org Chart in Google Sheets
Комментарии