filmov
tv
Visualizing Multi-variable Functions with Contour Plots

Показать описание
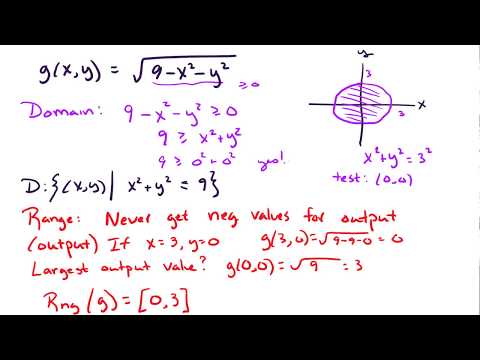
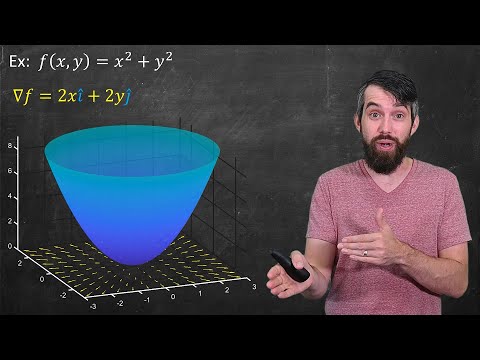
We've seen the graphs of single variable functions like y=x^2 throughout calculus, but now that we are in multivariable calculus and our graphs are of functions like f(x,y)=x^2+y^2 - that is, more than one input - what do they look like? We can use contour plots (sometimes called level curves) to get a nice picture in the two dimensional domain that will help us sketch the three dimensional graph of the function.
****************************************************
YOUR TURN! Learning math requires more than just watching videos, so make sure you reflect, ask questions, and do lots of practice problems!
****************************************************
****************************************************
Other Course Playlists:
***************************************************
► Want to learn math effectively? Check out my "Learning Math" Series:
►Want some cool math? Check out my "Cool Math" Series:
*****************************************************
*****************************************************
This video was created by Dr. Trefor Bazett
BECOME A MEMBER:
MATH BOOKS & MERCH I LOVE:
****************************************************
YOUR TURN! Learning math requires more than just watching videos, so make sure you reflect, ask questions, and do lots of practice problems!
****************************************************
****************************************************
Other Course Playlists:
***************************************************
► Want to learn math effectively? Check out my "Learning Math" Series:
►Want some cool math? Check out my "Cool Math" Series:
*****************************************************
*****************************************************
This video was created by Dr. Trefor Bazett
BECOME A MEMBER:
MATH BOOKS & MERCH I LOVE:
 0:07:54
Visualizing Multi-variable Functions with Contour Plots
 0:11:31
Visualizing Multi-Variable Functions with Contour Plot and Bubble Plot|Step by step demo in Minitab|
 0:08:38
Introduction to Multivariate Probability Density | Contour Plot | Data visualization |
 0:03:38
Multivariable Functions Lesson: Contour Plots
 0:05:38
Limits are...weird...for multi-variable functions | Limits along paths
 0:02:35
What are Level Sets?
 0:08:34
Level sets and contour maps, Multivariable Calculus
 0:10:45
14.1 Domain and range for multi-variable functions
 1:49:07
Calculus 3 Lecture 13.1: Intro to Multivariable Functions (Domain, Sketching, Level Curves)
 0:23:06
Level Curves and Traces of Multivariable Functions
 0:25:28
48. Visualizing Functions of Two Variables - Part 2 - Level Curves, Contour Maps, and Surfaces
 0:14:51
Geometric Meaning of the Gradient Vector
 0:41:36
11.1 a)Multivariable functions and level curves, contour maps
 0:05:08
contour maps, level curves
 0:01:05
Visualizing Contour Maps
 0:11:07
Graphing a Function of Two Variables
 0:18:27
How do you sketch level curves of multivariable functions?
 0:06:17
Gradient and contour maps
 0:02:18
The Gradient Vector Field
 0:16:50
What are the big ideas of Multivariable Calculus?? Full Course Intro
 0:10:10
Contour Plots || Contour Maps || Multivariable Functions || Calculus 3
 0:05:31
Gradient
 0:43:44
Contour Plots
 0:08:10
ALL of calculus 3 in 8 minutes.
Комментарии