filmov
tv
Visualizing Multi-Variable Functions with Contour Plot and Bubble Plot|Step by step demo in Minitab|

Показать описание
1.Minitab --- Graph --Bubble Chart (when three variables X, Y and Z) with Panel Review
2.Minitab -- Graph --Contour Plot when three variables X, Y and Z) with Panel Review
Function F3 press : Clears off the existing info and creates NEW entry
The above steps for navigations
Lean Six Sigma series, Lesson # 29 brings you a useful content how to plot in Minitab on Contour and Bubble plots
Resources on my channel :
Playlist of Lean & Six Sigma:
Playlist of overall Webinars and workshops : 10 + webinars
Playlist of Overall Storytelling series: 25 stories shared
Quality Tools and General:
Persian Cats :
English fluency development :
#Minitab #ContourPlot #BubblePlot
CONNECT:
If you would like to get connected with me:

Visualizing Multi-variable Functions with Contour Plots

Visualizing Multi-Variable Functions with Contour Plot and Bubble Plot|Step by step demo in Minitab|

Calculus 3 Lecture 13.1: Intro to Multivariable Functions (Domain, Sketching, Level Curves)

Level Curves and Traces of Multivariable Functions
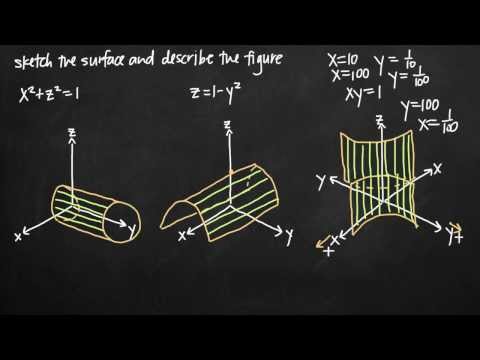
Sketching the quadric surface (KristaKingMath)
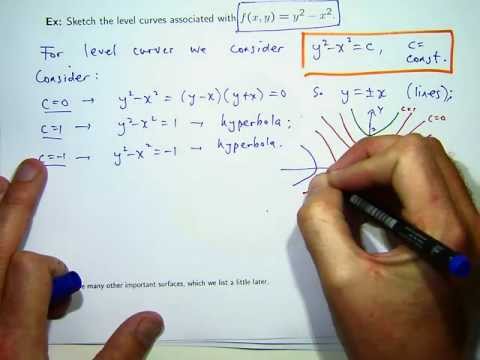
How to sketch level curves

Multivariable Functions Lesson: Contour Plots

11.1 a)Multivariable functions and level curves, contour maps

What are Level Sets?
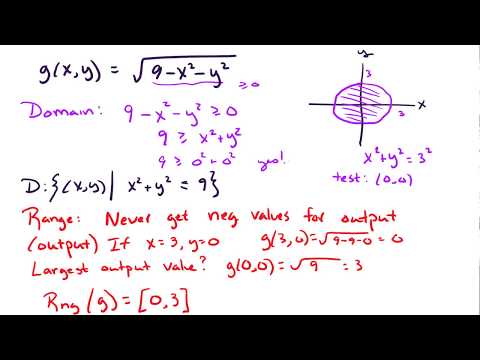
14.1 Domain and range for multi-variable functions

Estimating partial derivatives using level curves

How to Find the Level Curves of z = 12 - 3x - 4y

Contour Plots || Contour Maps || Multivariable Functions || Calculus 3

Level sets and contour maps, Multivariable Calculus

Introduction to Multivariate Probability Density | Contour Plot | Data visualization |

Limits are...weird...for multi-variable functions | Limits along paths

Two Variable Function Contour Maps (4K Lightboard Math Lecture)

Visualizing Contour Diagrams on a Surface

48. Visualizing Functions of Two Variables - Part 2 - Level Curves, Contour Maps, and Surfaces

Visualizing Contour Maps
How REAL Men Integrate Functions

Understanding Lagrange Multipliers Visually

contour maps, level curves

Multivariable Calculus Function: Contour Map & Implicit Differentiation (w/ Wolfram Mathematica)
Комментарии