filmov
tv
48. Visualizing Functions of Two Variables - Part 2 - Level Curves, Contour Maps, and Surfaces

Показать описание
In this video, we look at two more examples of functions of two variables. We sketch contour maps by setting z equal to several values in the range of the function, and then we use those contour maps and our knowledge of surfaces from an earlier chapter to sketch the surfaces in 3 dimensions.
 0:25:28
48. Visualizing Functions of Two Variables - Part 2 - Level Curves, Contour Maps, and Surfaces
 0:13:28
47. Visualizing Functions of Two Variables - Part 1 - First Example
 0:10:58
Visualizing the Fundamental Theorem of Algebra // Math Minute [#48]
 0:00:18
Growth of subcutaneous fat #meded #anatomy
 0:03:49
Exponential growth: How folding paper can get you to the Moon
 0:00:34
Human Calculator Solves World’s Longest Math Problem #shorts
 0:09:34
The Lp Norm for Vectors and Functions
 0:00:27
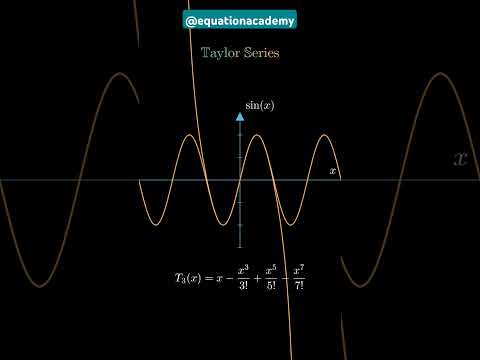
Taylor Series Visualization of Sinx.#maths#shorts#gcse #integration#mathematics #science#stem
 0:00:59
How to MANIFEST anything using this simple trick (trick the universe into delivering what you want)
 0:19:42
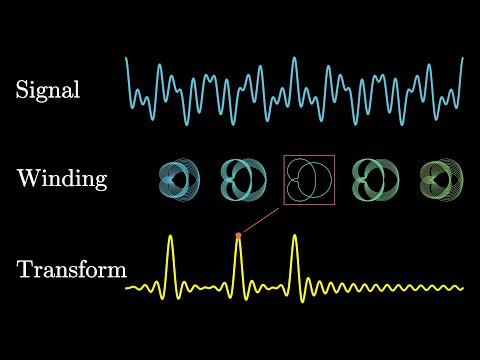
But what is the Fourier Transform? A visual introduction.
 0:00:08
Area between two curves ll GeoGebra ll Integral calculus
 0:11:32
Nervous System
 0:00:15
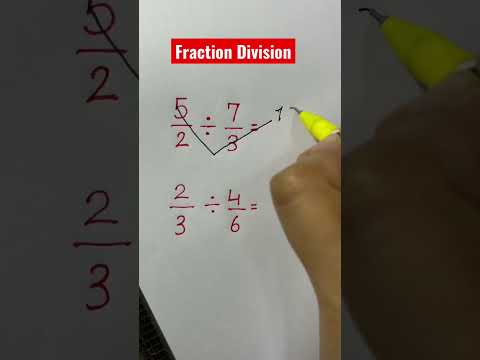
How to divide fractions?
 0:00:10
Fertility supplements - Get pregnant with these! #fertility #getpregnant #fertilitysupplements #ivf
 0:10:56
Power BI - Creating Map Visualization (Week 14 Day 2) | DAX-CALCULATE() function | Creating Measure
 0:00:42
What's the difference between mean, median, mode and range? Descriptive statistics explained
 0:00:55
Slope Intercept Form Of A Line
 0:00:14
Graph of Trignometric function y=a sinx (bx+c)
 0:00:29
Python in Excel‼️ #excel #python
 0:02:58
QuickSort in 3 Minutes
 0:28:23
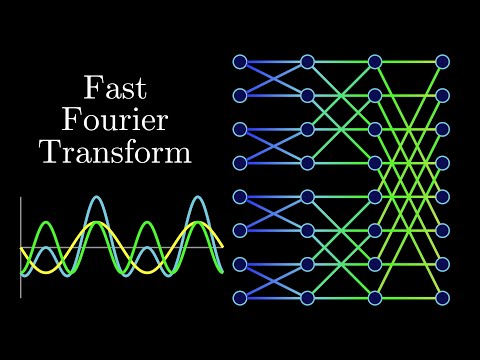
The Fast Fourier Transform (FFT): Most Ingenious Algorithm Ever?
 0:00:26
Acid Reflux Explained 🤔
 0:00:18
Draw a Multiple Bar Diagram in Excel
 0:00:16
How to pinch the abacus in 5 seconds!
Комментарии