filmov
tv
Example of Sampling Distribution of the Mean

Показать описание
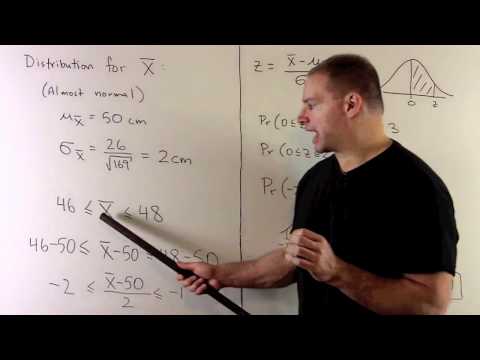
Statistics: A sample of 169 fish is randomly selected from a large fish population. Fish length X is distributed with a mean of 50 cm and a standard deviation of 26 cm. Find the probability that the sample's mean is between 46 and 48 cm.
 0:14:28
Sampling distribution example problem | Probability and Statistics | Khan Academy
 0:07:25
The Sampling Distribution of the Sample Mean (fast version)
 0:11:06
Sampling Distributions (7.2)
 0:07:18
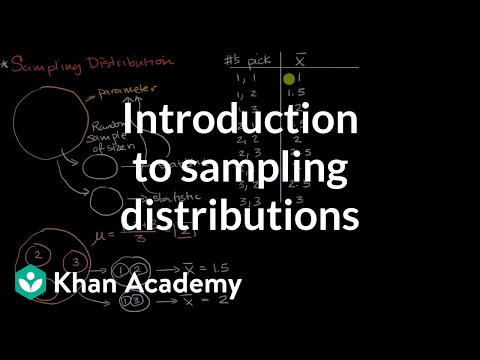
Introduction to sampling distributions | Sampling distributions | AP Statistics | Khan Academy
 1:01:09
Central Limit Theorem - Sampling Distribution of Sample Means - Stats & Probability
 0:04:28
Example of Sampling Distribution of the Mean
 0:11:40
The Sampling Distribution of the Sample Mean
 0:07:35
Probability of sample proportions example | Sampling distributions | AP Statistics | Khan Academy
 1:10:08
Module 4 OCR A-level Biology - Entire topic! Immunity | Biodiversity | Classification | Evolution
 0:09:49
The Sampling Distribution of the Sample Proportion
 0:04:44
Sampling Distribution of the Sample Mean--Example 3
 0:03:11
Sampling Distribution - Central Limit Theorem - Normal Distribution
 0:08:07
Sampling distribution of the difference in sample means | AP Statistics | Khan Academy
 0:07:52
Sampling Distributions: Introduction to the Concept
 0:03:52
Sampling distribution of the difference in sample proportions -Probability example
 0:09:57
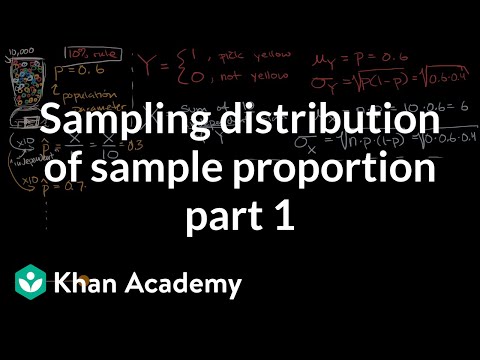
Sampling distribution of sample proportion part 1 | AP Statistics | Khan Academy
 0:17:31
Solving Problems Involving Sampling Distribution of the Sample Mean
 0:10:08
The Sampling Distribution of the Difference in Sample Means (X_1 bar - X_2 bar)
 0:02:47
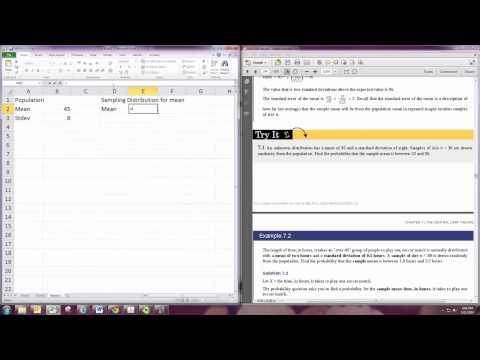
Sampling Distributions Excel
 0:03:09
Sample Proportions
 0:13:05
7.2 Sampling Distribution of the Mean (Updated)
 0:09:10
Applying the central limit theorem to find probability example 1
 0:02:53
Sampling Distribution of the Sample Mean--Example 1
 0:25:31
The Sampling Distribution of P-hat, The Sample Proportion. Includes Example problems.
Комментарии