filmov
tv
The Sampling Distribution of the Sample Mean

Показать описание
I discuss the sampling distribution of the sample mean, and work through an example of a probability calculation. (I only briefly mention the central limit theorem here, but discuss it in more detail in another video).
The mean and standard deviation of the amount of protein in a quarter pound patty of lean beef was found in the USDA nutrient database at:
For those using R, here is the R code to find the values in the examples:
The probability a randomly selected patty has at least 23.0 grams of protein (mu = 21.4, sigma = 1.9):
1-pnorm(23.0,21.4,1.9)
[1] 0.1998645
or, if we standardize:
1-pnorm((23.0-21.4)/1.9)
[1] 0.1998645
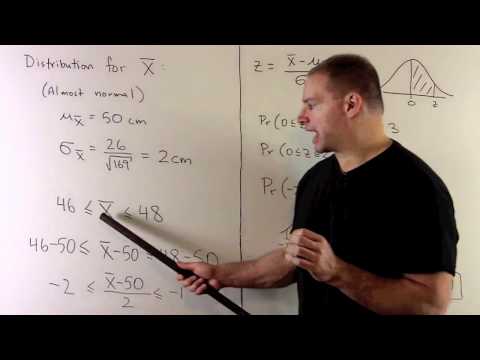
The probability that the mean of 4 randomly selected patties is at least 23.0 grams of protein (sampling from a normal distribution with mu = 21.4, sigma = 1.9):
1-pnorm(23.0,21.4,1.9/sqrt(4))
[1] 0.04607049
or, if we standardize:
1-pnorm((23.0-21.4)/(1.9/sqrt(4)))
[1] 0.04607049
The mean and standard deviation of the amount of protein in a quarter pound patty of lean beef was found in the USDA nutrient database at:
For those using R, here is the R code to find the values in the examples:
The probability a randomly selected patty has at least 23.0 grams of protein (mu = 21.4, sigma = 1.9):
1-pnorm(23.0,21.4,1.9)
[1] 0.1998645
or, if we standardize:
1-pnorm((23.0-21.4)/1.9)
[1] 0.1998645
The probability that the mean of 4 randomly selected patties is at least 23.0 grams of protein (sampling from a normal distribution with mu = 21.4, sigma = 1.9):
1-pnorm(23.0,21.4,1.9/sqrt(4))
[1] 0.04607049
or, if we standardize:
1-pnorm((23.0-21.4)/(1.9/sqrt(4)))
[1] 0.04607049
 0:11:06
Sampling Distributions (7.2)
 0:07:25
The Sampling Distribution of the Sample Mean (fast version)
 0:11:40
The Sampling Distribution of the Sample Mean
 0:06:24
Sampling Distribution of the Sample Proportion (7.4)
 0:03:11
Sampling Distribution - Central Limit Theorem - Normal Distribution
 0:12:00
The Sampling Distribution of the Sample Variance
 0:09:49
The Sampling Distribution of the Sample Proportion
 1:01:09
Central Limit Theorem - Sampling Distribution of Sample Means - Stats & Probability
 0:07:22
Hypothesis Testing on the Normal Distribution Practice Question
 0:08:07
Sampling distribution of the difference in sample means | AP Statistics | Khan Academy
 0:10:08
The Sampling Distribution of the Difference in Sample Means (X_1 bar - X_2 bar)
 0:09:08
Sampling distribution of the sample means (Normal distribution) | ExamSolutions
 0:07:52
Sampling Distributions: Introduction to the Concept
 0:38:54
Inferential Statistics Part 1: The Sampling Distribution
 0:22:12
Sampling Distribution | Statistics | Sampling Techniques | Population | WhiteBoard
 0:08:58
Sampling distribution of the difference in sample proportions | AP Statistics | Khan Academy
 0:09:57
Sampling distribution of sample proportion part 1 | AP Statistics | Khan Academy
 0:38:00
Sampling mean distribution and proportion distribution
 0:04:28
Example of Sampling Distribution of the Mean
 0:10:14
Sampling Distribution of the Sample Mean | ExamSolutions
 0:10:26
Review: Sampling Distribution of the Sample Proportion, Binomial Distribution, Probability (7.5)
 0:07:11
5.3 The sampling distribution | Basic Statistics | Sampling Distributions | UvA
 0:09:36
Shape of the sampling distribution
 0:37:54
Sampling and sampling Distribution | Sample | Sample Method | Bsusiness statistic | Part 1
Комментарии