filmov
tv
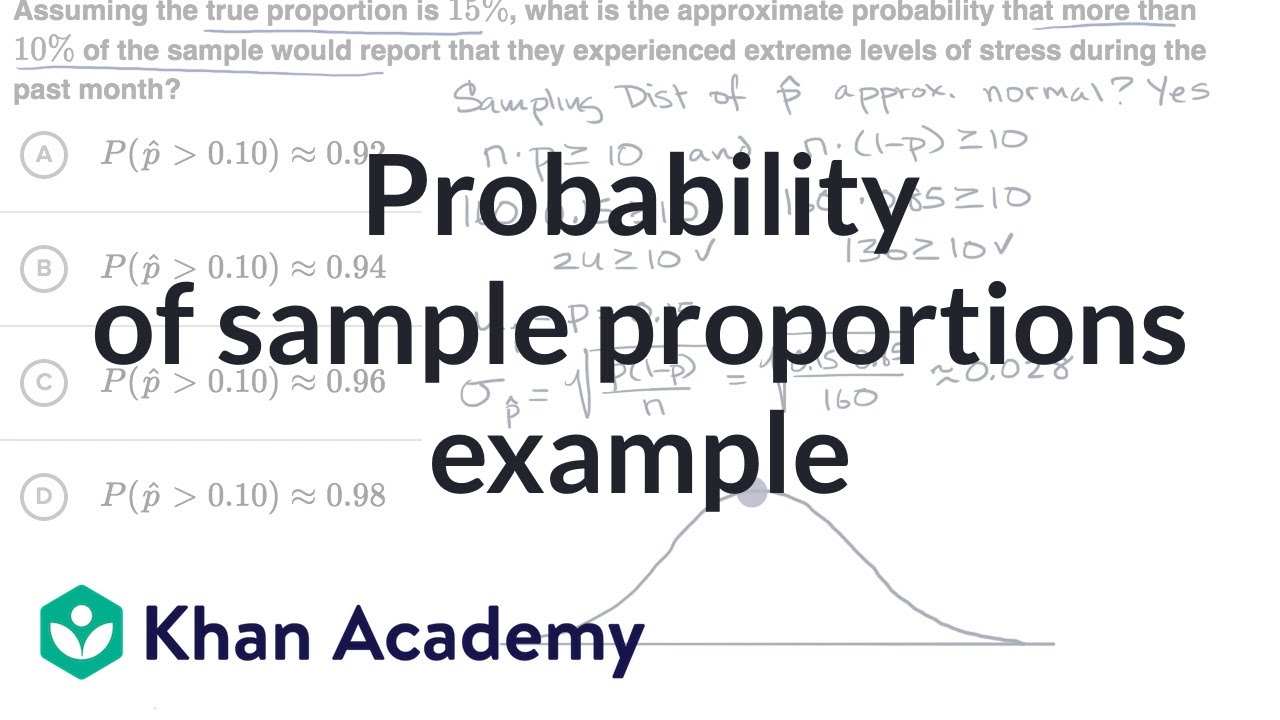
Probability of sample proportions example | Sampling distributions | AP Statistics | Khan Academy
Показать описание
Probability of sample proportions example.
AP Statistics on Khan Academy: Meet one of our writers for AP¨_ Statistics, Jeff. A former high school teacher for 10 years in Kalamazoo, Michigan, Jeff taught Algebra 1, Geometry, Algebra 2, Introductory Statistics, and AP¨_ Statistics. Today he's hard at work creating new exercises and articles for AP¨_ Statistics.
Khan Academy is a nonprofit organization with the mission of providing a free, world-class education for anyone, anywhere. We offer quizzes, questions, instructional videos, and articles on a range of academic subjects, including math, biology, chemistry, physics, history, economics, finance, grammar, preschool learning, and more. We provide teachers with tools and data so they can help their students develop the skills, habits, and mindsets for success in school and beyond. Khan Academy has been translated into dozens of languages, and 15 million people around the globe learn on Khan Academy every month. As a 501(c)(3) nonprofit organization, we would love your help! Donate or volunteer today!
 0:07:35
Probability of sample proportions example | Sampling distributions | AP Statistics | Khan Academy
 0:03:09
Sample Proportions
 0:08:14
Example: Finding probabilities with sample proportions
 0:09:49
The Sampling Distribution of the Sample Proportion
 0:13:53
probability of a sample proportions
 0:09:32
AP Statistics 7.2 Example Sampling Distributions for proportions
 0:09:57
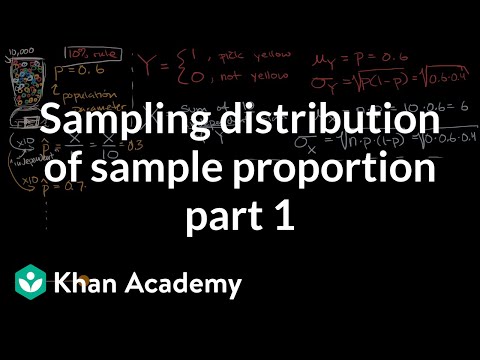
Sampling distribution of sample proportion part 1 | AP Statistics | Khan Academy
 0:03:52
Sampling distribution of the difference in sample proportions -Probability example
 0:01:59
Sample Proportions: In Class Example
 0:25:31
The Sampling Distribution of P-hat, The Sample Proportion. Includes Example problems.
 0:02:39
Example Difference of Proportions Probability
 0:11:31
Distribution of Sample Proportions and Central Limit Theorem
 0:28:26
Finding The Confidence Interval of a Population Proportion Using The Normal Distribution
 0:13:21
Sample proportions (definitions and basic example)
 0:06:44
Confidence Interval for a population proportion | Solved Problems
 0:06:22
Sampling Distribution for Sample Proportions Example
 0:06:21
More problems using sample proportions
 0:04:34
Sampling distribution of sample proportion part 2 | AP Statistics | Khan Academy
 0:09:50
Computation of the probability of the difference between Proportions | Sampling Distribution
 0:13:24
Finding the Central 'Symmetrical Limits' for Sample Proportions
 0:21:17
Example on Sampling Distribution for the Difference Between Sample Proportions
 0:11:24
Sampling Distribution for Proportions Example
 0:07:08
Sampling Distribution for Proportions Example.mp4
 0:07:09
Sampling Distributions of Sample Proportions
Комментарии