filmov
tv
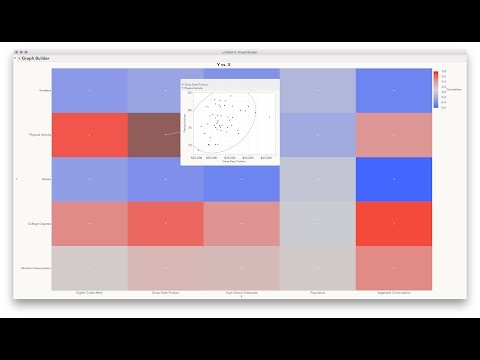
Correlation Heatmap X by Y in JMP

Показать описание
Since recording this video I have produced an add-in to generate all the output show in this video. You can find the add-in here:
In this video we see several methods for generating a scatterplot matrix as well as a heatmap of correlations between one set of X variables and another set of Y variables (rather than all X variables against all Y variables). Along the way we will also make a table of correlations with a certain set of X variables against a certain set of Y variables, add scatterplot images to this table using Tables- Update, create a heatmap in which we can hover over a section to see the scatterplot of the given variables, and finally how to create a heatmap of Spearman's Rho.
In this video we see several methods for generating a scatterplot matrix as well as a heatmap of correlations between one set of X variables and another set of Y variables (rather than all X variables against all Y variables). Along the way we will also make a table of correlations with a certain set of X variables against a certain set of Y variables, add scatterplot images to this table using Tables- Update, create a heatmap in which we can hover over a section to see the scatterplot of the given variables, and finally how to create a heatmap of Spearman's Rho.
 0:10:29
Correlation Heatmap X by Y in JMP
 0:08:28
Seaborn Heatmap - How to Visualise Correlations and Data With Heatmaps in Python
 0:00:42
What is correlation heatmap?
 0:04:51
Scatter Plots, Association and Correlation
 0:00:47
Correlation heatmap
 0:25:04
Creating Correlation Coefficient Heat Map and Triangle Correlation Coefficient Heat Map via Python
 0:09:22
Triangle Heatmap with Correlation Matrix | OriginPro | Statistics Bio7
 0:14:33
Tutorial 2- Feature Selection-How To Drop Features Using Pearson Correlation
 11:54:58
R programming 6 hours part 10
 0:03:02
5 ways to use a Seaborn Heatmap
 0:02:18
Finding correlations in data using Python.
 0:05:40
Correlation analysis
 0:03:28
Creating maps using X and Y coordinates - JMP
 0:07:47
Covariance Clearly Explained!
 0:16:24
Heatmap using Matplotlib | Python | Sunny Solanki
 0:07:40
heatmap in R: Tutorial 10-Heatmap, Data Visualization using R , GGplot2, data correlation
 0:05:15
Correlation Explained in Hindi
 0:22:00
Correlation Matrix and Plot in Python - Exploratory Data Analysis - Hepatitis C Infection analysis
 0:13:03
Seaborn heatmap | How to make a heatmap in Python Seaborn and adjust the heatmap style
 0:06:56
Feature Selection and Dimensionality reduction using Covariance Matrix Heatmap
 0:11:36
Calculate Correlation in Python and Create a Correlation Matrix in Seaborn!
 0:12:30
Seaborn heatmap
 0:14:02
Heatmap in R with Diet-Microbiome Data | Nutribiomes
 0:06:39
Box-Plot (Simply explained and create online)
Комментарии