filmov
tv
Seaborn heatmap

Показать описание
This tutorial will look at creating and customizing heatmaps using the seaborn library in python.
Thanks for watching!
Roshan Cyriac Mathew
Subscribe to my channel on:
Stay updated on my Instagram page:
Link to code on Git Hub:
Some of the topics covered in this video include:
how to create a basic heatmap,
how to change the size of the heatmap,
how to change the data on the x-axis and y-axis,
how to turn off the colour bar,
how to change the orientation of the colour bar,
how to add a line between the cells in the heatmap,
how to add values in the heatmap (how to add annotation),
how to change the colour of the heatmap (using the cmap parameter),
how to plot a heatmap correlation matrix,
how to plot the lower half of the correlation matrix,
how to customize the font and style in the correlation matrix.
link to colourmaps shown in the video:
#heatmap #seaborn #datavisualization
 0:13:03
Seaborn heatmap | How to make a heatmap in Python Seaborn and adjust the heatmap style
 0:03:02
5 ways to use a Seaborn Heatmap
 0:08:28
Seaborn Heatmap - How to Visualise Correlations and Data With Heatmaps in Python
 0:08:05
Seaborn Heatmap | How to Make a Heatmap in Python Seaborn and Adjust the Heatmap Style
 0:11:27
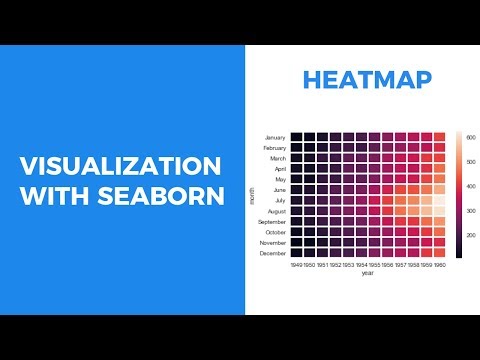
VISUALIZATION WITH SEABORN - HEATMAP
 0:22:39
Seaborn Is The Easier Matplotlib
 0:00:10
Heatmap using python seaborn #pythonlearning #viral #pythongraphics #seaborn #pythonprogramming
 0:10:08
Create Heatmaps in Python with Seaborn: Step-by-Step Tutorial
 0:12:30
Seaborn heatmap
 0:17:26
Seaborn: Heatmap
 0:12:28
Heatmaps in Seaborn | Part 5 | Complete Seaborn Series
 0:01:47
How to Make a Heatmap using Python and Seaborn
 0:03:33
Create Heatmap Plot in Seaborn
 0:08:41
Seaborn heatmaps: Everything you need to get started
 0:06:54
Create a Heatmap using Seaborn
 0:15:34
Seaborn Heatmap- A Deep Dive into Visualising Trends & Patterns using Python
 0:02:28
How to use divergent colormap in Seaborn heatmap in Python
 0:00:53
combine seaborn heatmap with matplotlib subplots in PyTorch
 0:27:53
Seaborn HeatMap Plot Method in Python - Complete Guide
 0:08:49
Heatmap in Python | Seaborn Python Tutorial | Seaborn Heatmaps
 0:07:13
Multivariate Data Analysis: League of Legends Heatmap
 0:00:55
Create Heatmaps With Python | Python Tutorial
 0:05:58
Data Visualization using Seaborn | Heatmaps
 0:09:39
HEAT MAP || SEABORN
Комментарии