filmov
tv
Correlation analysis

Показать описание
With the help of correlation analysis, the linear relationship between variables can be examined. The strength of the correlation is determined by the correlation coefficient, which varies from -1 to +1. This means that correlation analyses can be used to make a statement about the strength and direction of the relationship between two variables.
Interpret correlation
Positive correlation
A positive correlation exists when larger values of variable A are accompanied by larger values of variable B. Body size and shoe size, for example, correlate positively, resulting in a correlation coefficient that lies between 0 and 1, i.e. a positive value.
Negative correlation
A negative correlation exists when larger values of variable A are accompanied by smaller values of variable B. The product price and the sales volume usually have a negative correlation; the more expensive a product is, the lower the sales volume. In this case, the correlation coefficient lies between -1 and 0, i.e. it takes on a negative value.
More information on correlation analysis:
And here is the online correlation calculator:
 0:05:40
Correlation analysis
 0:27:00
Correlation Analysis - Full Course
 0:19:13
Pearson's Correlation, Clearly Explained!!!
 0:07:50
Pearson correlation [Simply explained]
 0:04:18
Introduction to Correlation (Statistics)
 0:09:52
Introduction to Correlation Analysis in Excel
 0:12:57
Correlation Coefficient
 0:17:24
Pearson Correlation Analysis using SPSS - Running, Interpreting, and Reporting
 0:08:18
Correlation Analysis in SPSS
 0:07:51
Correlation Vs Regression: Difference Between them with definition & Comparison Chart
 0:04:33
What Is Correlation? | Types of Correlation | Correlation Coefficient | Statistics | Simplilearn
 0:09:53
04 Correlation in SPSS – SPSS for Beginners
 0:07:33
How To Create A Correlation Matrix In Excel (With Colors!)
 0:02:14
How to Calculate a Correlation in Microsoft Excel - Pearson's r
 0:08:05
Correlation Analysis in Excel
 0:14:33
Correlation
 0:08:34
#13 Correlation Analysis - Pearson's Correlation Coefficient |DM|
 0:04:31
How To Perform A Pearson Correlation Test In Excel
 0:09:26
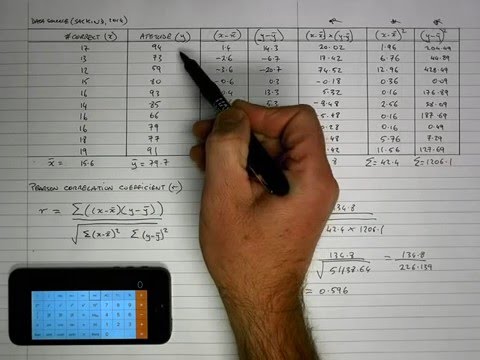
How To... Calculate Pearson's Correlation Coefficient (r) by Hand
 0:05:16
How to Calculate a Correlation (and P-Value) in Microsoft Excel
 0:14:07
Calculating Correlation (Pearson's r)
 0:12:55
Introduction to Correlation & Regression, Part 1
 0:24:43
Correlation Analysis & Coefficient
 0:10:24
Correlation analysis, meaning, type, degree, Business Statistics and Analytics aktu, mba, bba
Комментарии