filmov
tv
Triangle Heatmap with Correlation Matrix | OriginPro | Statistics Bio7

Показать описание
In this video tutorial, I will show you How to Draw a Triangle Heatmap with Correlation Matrix by using the Origin Pro 2022 version.
Data Requirements: YYYY columns
Software Version : OriginPro 2022
Disclaimer
This video is made for the sole purpose of higher education. Care is taken to provide the most accurate information. However, we can’t guarantee the accuracy of all the information in this video. Kindly do your own research before coming to any conclusions or making any decisions.
#biostatistics #statistics #dataanalysis #statisticalanalysis
#datavisualization #datascience #dataanalytics #datamining #heatmap #correlation #correlationcoefficient #originlab #origin #originpro
Playlists:
Follow me:
Join this YouTube channel membership:
 0:09:22
Triangle Heatmap with Correlation Matrix | OriginPro | Statistics Bio7
 0:03:16
How to create correlation matrix and correlation plot - Heatmap in Excel - Tutorial [Quick Method]
 0:09:54
How to Create Triangle Heatmap from Correlation Matrix | Origin Pro | Urdu/Hindi
 0:10:02
How to make a correlation matrix in excel using conditional formatting
 0:25:04
Creating Correlation Coefficient Heat Map and Triangle Correlation Coefficient Heat Map via Python
 0:03:37
Draw Correlation Plot in Origin Pro | Correlation Coefficient | Very Easy
 0:11:04
Visualization of correlation matrix in R | ggcorrplot tutorial | ggplot2 extension | R Tutorial
 0:04:11
Correlation Plot App
 0:06:37
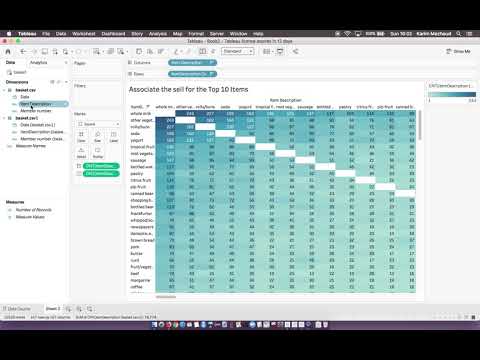
TABLEAU: HeatMap Correlation of the Top 10 sold Items
 0:00:47
Correlation heatmap
 0:08:48
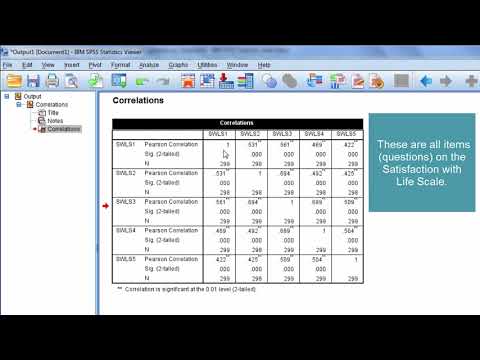
Pearson's correlation matrix with p-values in R
 0:06:34
Correlation in R | Pearson correlation coefficients with significance** , p-values and Heat map|
 0:07:33
How To Create A Correlation Matrix In Excel (With Colors!)
 0:09:24
Lower Triangular of Scatter Matrix | Pearson Correlation Coefficient | OriginPro
 0:08:46
How to make a correlation matrix in python
 0:01:12
How to Interpret a Correlation Matrix
 0:01:13
R : How to do a triangle heatmap in R using ggplot2, reshape2, and Hmisc?
 0:08:28
Seaborn Heatmap - How to Visualise Correlations and Data With Heatmaps in Python
 0:07:15
Correlation Matrix Heat Map || Graphical Representation of Correlation Matrix
 0:04:02
How to draw a Correlation Heatmap with Dendrogram in R Studio | Biostatistics | Statistics Bio7
 0:00:20
One Chart Type A Day - Correlation Heatmap
 0:00:34
Create Heat Map in Seconds
 0:13:08
How to Create Correlation Plots in R
 0:03:02
Excel: Creating a heat map of the golden triangle for search results page
Комментарии