filmov
tv
Excel Magic Trick 1435: DAX Query to Export Data from Data Model to Excel Sheet & Much More!

Показать описание
Download File:
See how to query the Data Model with DAX Code to Export Data to an Excel Sheet:
1. (00:14) Introduction, including looking at Data Model that downloadable file contains
2. (02:13) Use Existing Connections in Data Ribbon Tab to import data from Data Model into an Excel Sheet (Worksheet). See Edit DAX feature to pull data from Data Model into an Excel Sheet
3. (03:34) Use DAX Studio to create DAX Query
4. (04:42) EVALUATE Command
5. (05:07) Zoom feature in DAX Studio
6. (05:18) Expand Tables in Data Model to expose Columns
7. (05:38) CALCULATETABLE DAX Function to query a table based on three conditions, one each from three different dimension (lookup) tables, in order to return a subset table of a larger table. CALCULATETABLE is a function that can create a table based on a set of conditions or criteria from one or more tables.
8. (07:53) ADDCOLUMNS DAX Function to add columns to the output from the CALCULATETABLE Function for Retail Price and Standard Cost using the RELATED Function. ADDCOLUMNS is an iterative function that will iterate over a table and create an extra column.
9. (08:45) REALTED DAX Function to look up a price and cost for each product in each record of the table.
10. (10:19) Create an OR Logical Test in the CALCULATETABLE Function using the Or Operator Double Vertical BAR | |.
11. (12:01) Use DAX Formatter in DAX Studio to format DAX Query Code so it can be read more easily.
12. (13:04) Copy code from DAX Studio and paste into Edit DAX Dialog box in Excel in order to Query the Data Model and return a subset table to our Excel Sheet (Worksheet).
13. (13:48) Add Helper Column to DAX Query Table (Excel Table) to calculate Revenue
14. (15:07) Update and edit DAX Query Code in Edit DAX Dialog box to add a new column to the DAX Query Table (Excel Table) using a second RELATED Function to get the Standard Cost column.
15. (16:43) Unlink Table from Data Model.
16. (17:09) Summary
 0:17:49
Excel Magic Trick 1435: DAX Query to Export Data from Data Model to Excel Sheet & Much More!
 0:12:12
Excel Magic Trick 1434: SAMPLE DAX Function to Take Random Stratified Sample from Data Set.
 0:16:16
Excel Magic Trick 1440: OR Logical Test on 2 Columns using DAX IN Operator & DAX OR Function
 0:08:00
Excel Magic Trick 1437: DAX Query OR Logical Test IN Operator: Pull Sales Team Data to Excel Sheet
 0:06:52
Excel Magic Trick 1439: DAX Measures to Create Cross Tabulated OR & AND Logical Test Sales Total
 0:08:54
Excel Magic Trick 1442 DAX Query & EXCEPT Function to Extract Items In List 1 That Are NOT In Li...
 0:12:46
Excel Magic Trick 1407: Data Model & DAX Measures for Monthly Totals Report From Two Fact Tables
 0:35:56
Excel Magic Trick 1451: Hack Data Model, Date Table & DAX Measures WITHOUT buying Power Pivot
 0:12:14
Excel Magic Trick 1427: DAX GEOMEANX function: Average Compounding Rate per Period for FV Calc
 0:14:01
Excel Magic Trick 1408: DAX Measure: Moving 12 Month Average on Daily Sales (DAX Formatter too)
 0:41:14
Excel Magic Trick 1398: DAX Formulas for Running Total and % of Running Total & other DAX Tricks
 0:21:12
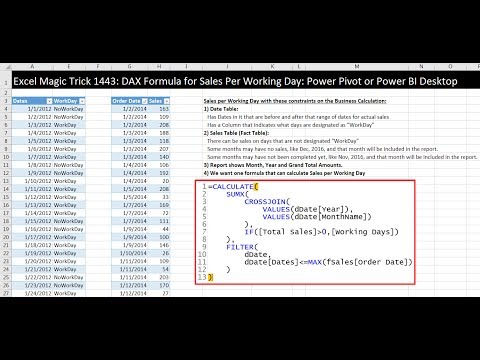
Excel Magic Trick 1443: DAX Formula for Sales Per Working Day: Power Pivot or Power BI Desktop
 0:11:22
Excel Magic Trick 1403: DAX Formulas: Explicit or Implicit Measures? Why Explicit is Better.
 0:06:07
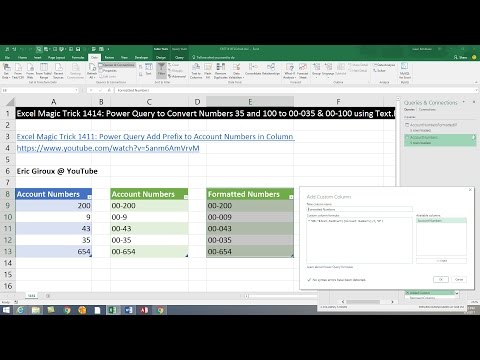
Excel Magic Trick 1414: Power Query Text.PadStart Function to Correctly Format Account Numbers
 0:10:30
Excel Magic Trick 1454 DAX Measure Count Customer Totals Between Upper Lower Limits, Each Month
 0:20:15
Excel Magic Trick 1433: Materialize DAX Table Functions: Existing Connections, DAX Studio, Power BI?
 0:13:46
Excel Magic Trick 1453 Array Formula Count Customer Totals Between Upper Lower Limits, Each Month
 0:04:41
Excel Magic Trick 1404: Sales Per Working Day by Month using Power Query
 0:10:09
Excel Magic Trick 1269: Excel 2016: Without Power Pivot: DAX Measures, Relationships & Data Mode...
 0:06:07
Excel Magic Trick 1438: Excel Formula to Create Cross Tabulated OR & AND Logical Test Sales Tota...
 0:04:27
Excel Tip 4: Automate Reports with Power Pivot and DAX
 0:19:53
DAX Fridays! #86: What is DAX? (and compare it to Excel formulas)
 0:21:05
Excel Magic Trick 1347: Power Query Function: Split Master Table into Sub Tables for Each Product
 0:06:15
Excel Magic Trick 1386: Power Query to Import & Append Large Text File in Power Pivot Data Model
Комментарии