filmov
tv
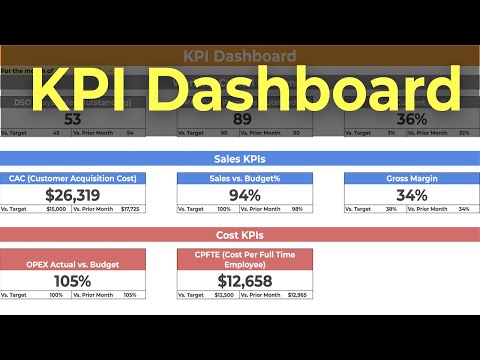
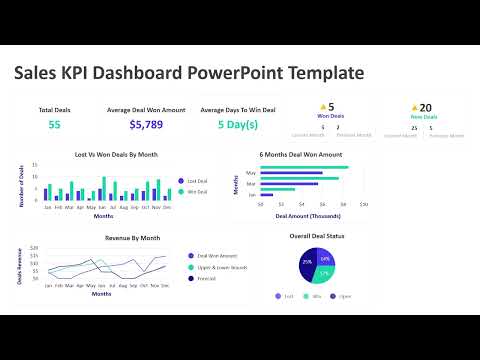
Sales KPI Dashboard from an Excel Spreadsheet

Показать описание
This demo shows how to use Excel Spreadsheets as data source to create dashboard.
When new data is available just drop the new file all visualizations will instantly update without having to repeat yourself.
Introduction 00:00
Import Spreadsheet File 00:25
Create Sum of Sales per Line Bar Chart 00:45
Create Sales per Line by Year Area Chart 02:35
Create Dashboard Layout 03:20
When new data is available just drop the new file all visualizations will instantly update without having to repeat yourself.
Introduction 00:00
Import Spreadsheet File 00:25
Create Sum of Sales per Line Bar Chart 00:45
Create Sales per Line by Year Area Chart 02:35
Create Dashboard Layout 03:20
 0:01:19
 0:13:08
 0:00:23
 0:02:52
 0:02:23
 0:09:28
 0:22:13
 0:04:36
 0:23:45
 0:46:05
 0:43:53
 0:31:20
 0:12:39
 0:03:02
 0:02:45
 0:00:15
 0:00:27
 0:12:42
 0:00:30
 0:07:31
 0:03:29
 0:19:47
 0:45:29
 0:14:58