filmov
tv
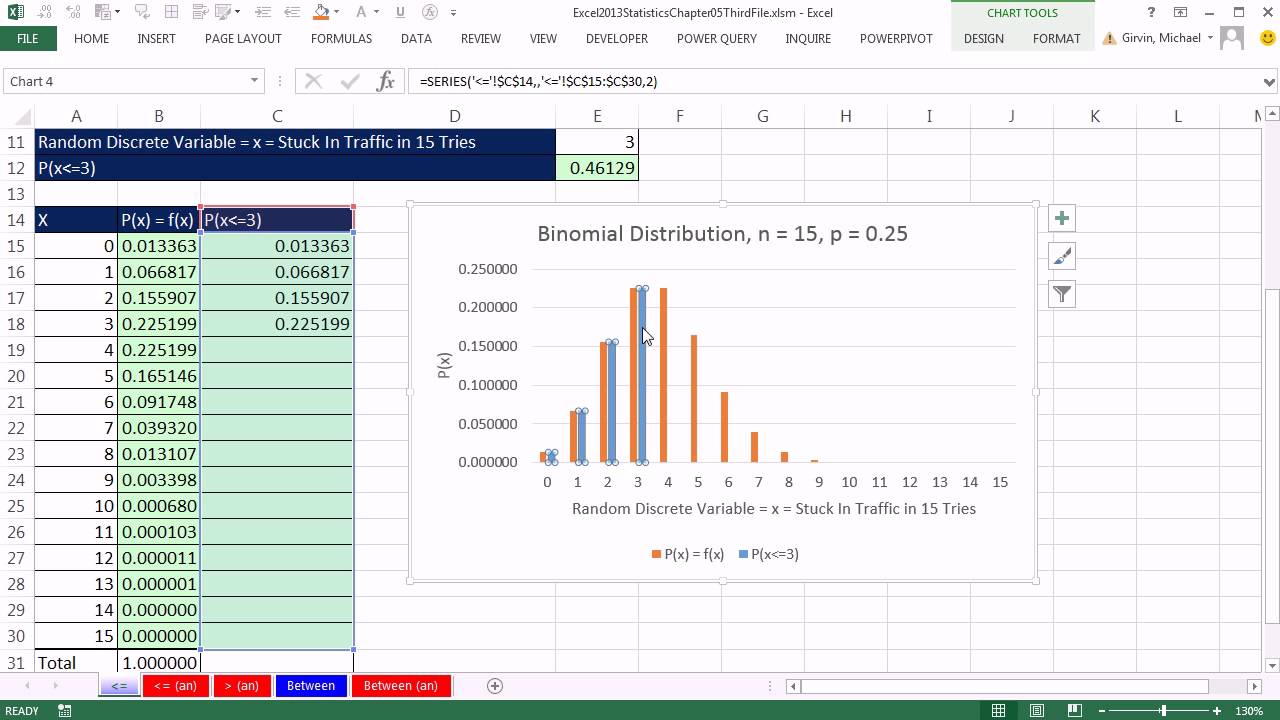
Excel 2013 Statistical Analysis #36: Dynamic Binomial Probability Charts (3 Examples)
Показать описание
Topics in this video:
1. (00:08) Problem Setup
2. (01:02) Less Than or Equal To Dynamic Binomial Probability Chart with IF function and Dynamic Text Labels
3. (10:30) Great Than Dynamic Binomial Probability Chart with IF function and Dynamic Text Labels
4. (12:53) Between Dynamic Binomial Probability Chart with IF function and Dynamic Text Labels
 0:19:41
Excel 2013 Statistical Analysis #36: Dynamic Binomial Probability Charts (3 Examples)
 0:11:14
EXCEL 2013 Chapter 36: Performing Spreadsheet What-If Analysis
 0:09:01
Excel 2013 Statistical Analysis #37: Introduction to Continuous Probability Distributions
 0:15:48
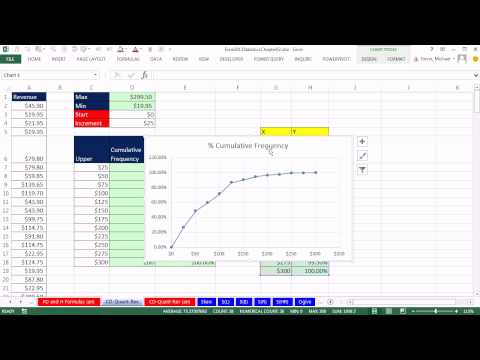
Excel 2013 Statistical Analysis #09: Cumulative Frequency Distribution & Chart, PivotTable &...
 1:21:50
Highline Excel 2013 Class Video #35: Excel 2013 PivotTables: Basic To Advanced 58 Examples
 2:22:43
Excel 2013 Statistical Analysis #01: Using Excel Efficiently For Statistical Analysis (100 Examples)
 0:24:47
Excel Statistical Analysis 36: Sampling & Sampling Distribution of Sample Means (Xbar)
 0:15:06
Highline Excel 2013 Class Video 36: Excel Filter For Extracting Records with AND or OR Criteria
 0:07:51
Excel 2013 Statistical Analysis #35: Hypergeometric Distribution and HYPGEOM.DIST Function
 0:01:21
Mastering Excel 2013 Lesson 41 Formatting Charts In Excel 36
 0:37:51
Excel 2013 Statistical Analysis #33: Binomial Probability Distributions: Tables, Charts, Functions
 0:06:52
Basic Excel Business Analytics #37: Excel 2016 Data Tab, Get & Transform: Unpivot feature
 0:00:29
Fill Serial Numbers in Excel Efficiently with Formula
 0:41:36
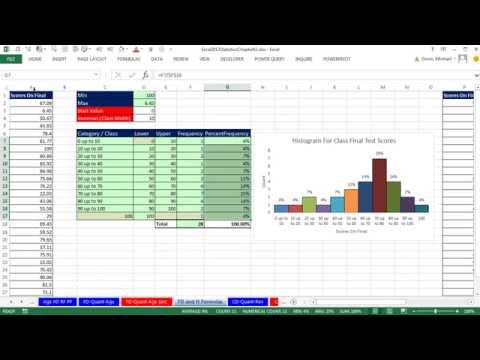
Excel 2013 Statistical Analysis #8: Frequency Distributions, Histograms, Skew, Quantitative Variable
 0:00:28
Excel 2013 Web App Data Analysis Tools
 0:08:39
Excel 2013 Statistical Analysis #41: Answering Probability Questions With NORM.DIST Function
 0:06:16
Basic Excel Business Analytics #36: Power Query to Unpivot Data (Multiple Columns to Single Column)
 0:19:22
Excel 2013 Statistical Analysis #24: Numerical Measures: Covariance and Correlation Coefficient
 0:43:39
Office 2013 Class 43, Excel Basics 25, Excel 2013 Charts: Chart Types, Chart Formatting, more
 0:32:08
Excel 2013 Statistical Analysis #31: Create Discrete Probability Distribution, Calculate Mean and SD
 0:00:16
How to calculate PERCENTAGE in excel? | Percentage Formula #shorts #excel
 0:23:45
Excel 2013 Statistical Analysis #34: POSSION Distribution and POISSON.DIST Function
 0:09:15
Excel 2013 Video 36 Why The Macro Recorder is so Inefficient
 0:00:25
Rank Formula in Excel
Комментарии