filmov
tv
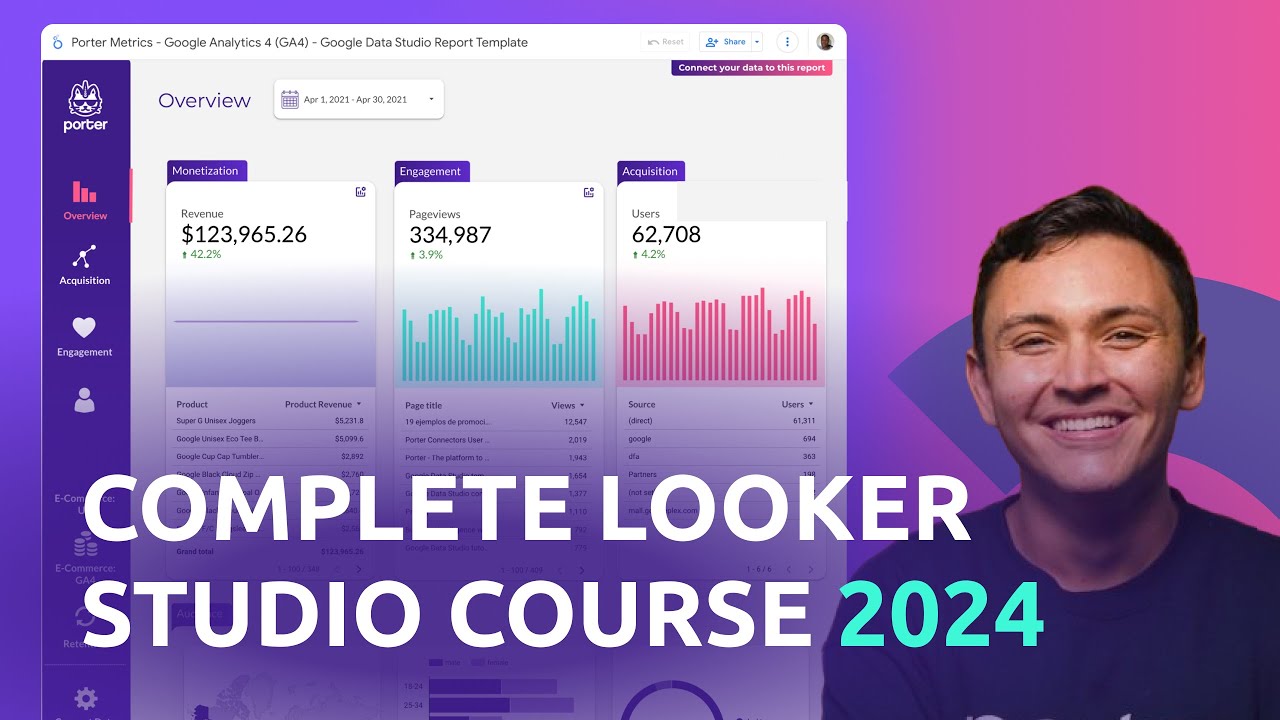
Looker Studio (formerly Google Data Studio) FREE complete tutorial (2024) for marketers
Показать описание
Learn how to visualize your marketing data using Looker Studio (formerly Google Data Studio) with Juan Bello, founder of Porter Metrics.
What you will learn:
00:00 Why marketers should learn Looker Studio
04:33 How to connect data sources to your reports
27:29 How to create charts and graphs
47:19 Learn how to add and edit controls to create interactive reports
1:06:50 How to add internal filters to your charts
1:10:58 How to create calculated fields
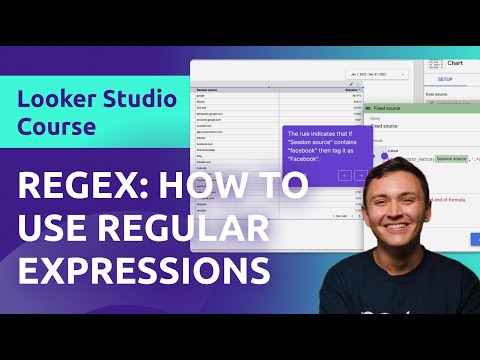
1:24:49 How to use Regular Expressions (REGEX) in Looker Studio
1:43:06 How to blend data and combine different data sources
2:07:19 How to design your reports
2:22:20 Learn how to share your reports (PDF, automated email delivery, link, etc.)
What you will learn:
00:00 Why marketers should learn Looker Studio
04:33 How to connect data sources to your reports
27:29 How to create charts and graphs
47:19 Learn how to add and edit controls to create interactive reports
1:06:50 How to add internal filters to your charts
1:10:58 How to create calculated fields
1:24:49 How to use Regular Expressions (REGEX) in Looker Studio
1:43:06 How to blend data and combine different data sources
2:07:19 How to design your reports
2:22:20 Learn how to share your reports (PDF, automated email delivery, link, etc.)
 2:31:23
Looker Studio (formerly Google Data Studio) FREE complete tutorial (2024) for marketers
 0:31:52
Looker Studio tutorial for Google Analytics 4 | GA4 + Google Data Studio
 0:12:57
Google Looker Studio Tutorial 2023
 0:08:04
Looker Studio Tutorial For Beginners 2024 (Step-By-Step)
 0:24:10
How to blend data in Looker Studio (Formerly Google Data Studio)
 0:08:22
7 ESSENTIAL Looker Studio HACKS EVERYONE Should Know!
 0:13:50
How to Build Calculated Fields in Looker Studio (Formerly Google Data Studio)
 1:50:49
FULL Google Data Studio Course (2023) ➡️ rebranded to Looker Studio) [Compilation]
 1:23:28
Looker Studio: Comprehensive Tutorial (Formerly Data Studio)
 0:17:27
Get Started with Looker Studio in 15 Minutes | 2023 Looker Studio Tutorial For Beginners
 0:01:57
Google Data Studio Explained in 100 seconds
 0:01:04
Looker Studio vs Google Data Studio
 0:20:12
Ultimate Step by Step Google Looker Studio Dashboard Project | End to End Dashboard Project Tutorial
 0:15:12
How to Design Your Google Looker Studio Reports (2024): White-labeling, Branding, and Customization
 0:13:57
📊 All Types of Looker Studio (Google Data Studio) Charts
 0:19:32
How to create and edit controls in Looker Studio (formerly Google Data Studio)
 0:30:21
Build an SEO Dashboard in Looker Studio (Data Studio)
 0:08:36
1.2. What's Looker Studio? (Formerly Google Data Studio) (Looker Studio Tutorial for Beginners)
 0:17:58
Visualizing Google Sheets in Looker Studio Using These Tips
 0:00:06
Refresh data in Google Looker Studio/ Data Studio
 0:24:51
📊 📈 Looker Studio Tutorial for Beginners 2024
 0:23:10
How to use Regular Expressions (REGEX) in Looker Studio (formerly Google Data Studio)
 0:09:17
Unlock 🔓 Looker Studio Scorecard Potential😍 Visualise Key Metrics in 3 EASY way (Google Data Studio)...
 0:15:28
Looker Studio Tutorial For Beginners
Комментарии