filmov
tv
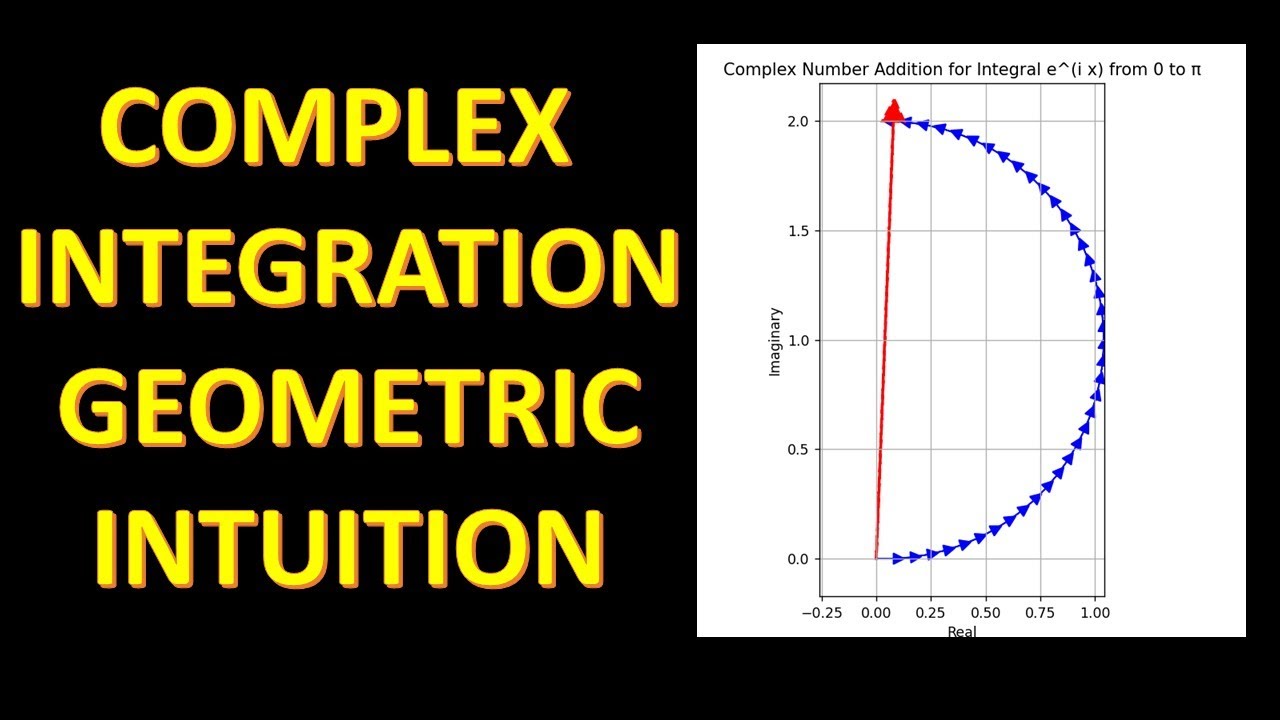
Geometric Animation of Integrating e^(ix) from 0 to π
Показать описание
In this video, we demonstrate the process of visualizing the integration of complex numbers along the curve e^(ix) from 0 to π using arrows. This approach helps provide an intuitive understanding of complex number integration and how it relates to vector addition.
Complex number integration involves summing up the contributions of complex numbers along a curve in the complex plane. In our example, we consider the curve e^(ix) from 0 to π, where x is the real variable and i is the imaginary unit (i^2 = -1).
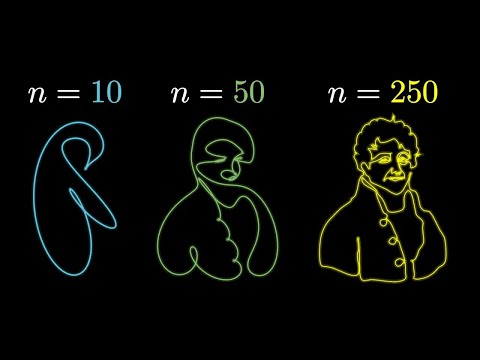
We start by dividing the interval [0, π] into 'n' equally spaced points. For each point, we calculate the corresponding complex number e^(ix), which lies on the unit circle in the complex plane. The magnitude of each complex number is scaled by the difference in angle between consecutive points (delta_theta), which represents the arc length along the unit circle.
To visualize the integration, we draw scaled arrows from the origin to each complex number in the complex plane. The arrow representing the complex number at a point x is the vector from the origin to the point e^(ix) scaled by delta_theta. The sum of these arrows represents the integral of e^(ix) from 0 to π.
As we animate the process of adding the scaled arrows, you can see how the vector sum approximates the integral. This visualization helps build intuition for complex number integration and provides a clear understanding of the relationship between complex numbers and vector addition in the complex plane.
Watch the video to see this fascinating process in action and gain a deeper understanding of complex number integration!
Complex number integration involves summing up the contributions of complex numbers along a curve in the complex plane. In our example, we consider the curve e^(ix) from 0 to π, where x is the real variable and i is the imaginary unit (i^2 = -1).
We start by dividing the interval [0, π] into 'n' equally spaced points. For each point, we calculate the corresponding complex number e^(ix), which lies on the unit circle in the complex plane. The magnitude of each complex number is scaled by the difference in angle between consecutive points (delta_theta), which represents the arc length along the unit circle.
To visualize the integration, we draw scaled arrows from the origin to each complex number in the complex plane. The arrow representing the complex number at a point x is the vector from the origin to the point e^(ix) scaled by delta_theta. The sum of these arrows represents the integral of e^(ix) from 0 to π.
As we animate the process of adding the scaled arrows, you can see how the vector sum approximates the integral. This visualization helps build intuition for complex number integration and provides a clear understanding of the relationship between complex numbers and vector addition in the complex plane.
Watch the video to see this fascinating process in action and gain a deeper understanding of complex number integration!
 0:02:28
Geometric Animation of Integrating e^(ix) from 0 to π
 0:04:08
e^(iπ) in 3.14 minutes, using dynamics | DE5
 0:03:57
WHY DOES e^ix FORM A CIRCLE IN THE COMPLEX PLANE?
 0:13:11
Why do trig functions appear in Euler's formula?
 0:00:50
5 simple unsolvable equations
 0:00:53
Geometry of sums of powers of 1/5
 0:00:54
Do you know Leonardo da Vinci's circle area proof?
 0:03:55
The Difference Between Real & Virtual Images | Geometric Optics | Physics Demo
 0:13:50
What's so special about Euler's number e? | Chapter 5, Essence of calculus
 0:05:47
Imaginary Numbers Are Real [Part 1: Introduction]
 0:27:16
Differential equations, a tourist's guide | DE1
 0:08:44
The Line Integral, A Visual Introduction
 0:15:29
Double and Triple Integrals
 0:05:39
Higher order derivatives | Chapter 10, Essence of calculus
 0:12:02
What is e and ln(x)? (Euler's Number and The Natural Logarithm)
 0:15:51
But why is a sphere's surface area four times its shadow?
 0:20:46
Integration and the fundamental theorem of calculus | Chapter 8, Essence of calculus
 0:12:39
What does area have to do with slope? | Chapter 9, Essence of calculus
 0:00:42
Geometry From the Home of the GOAT!!!
 0:22:20
Taylor series | Chapter 11, Essence of calculus
 0:00:21
functions explained in 17 seconds! (Algebra 1)
 0:24:47
But what is a Fourier series? From heat flow to drawing with circles | DE4
 0:00:58
How I made HOW in Geometry Dash #shorts
 0:17:05
The essence of calculus
Комментарии