filmov
tv
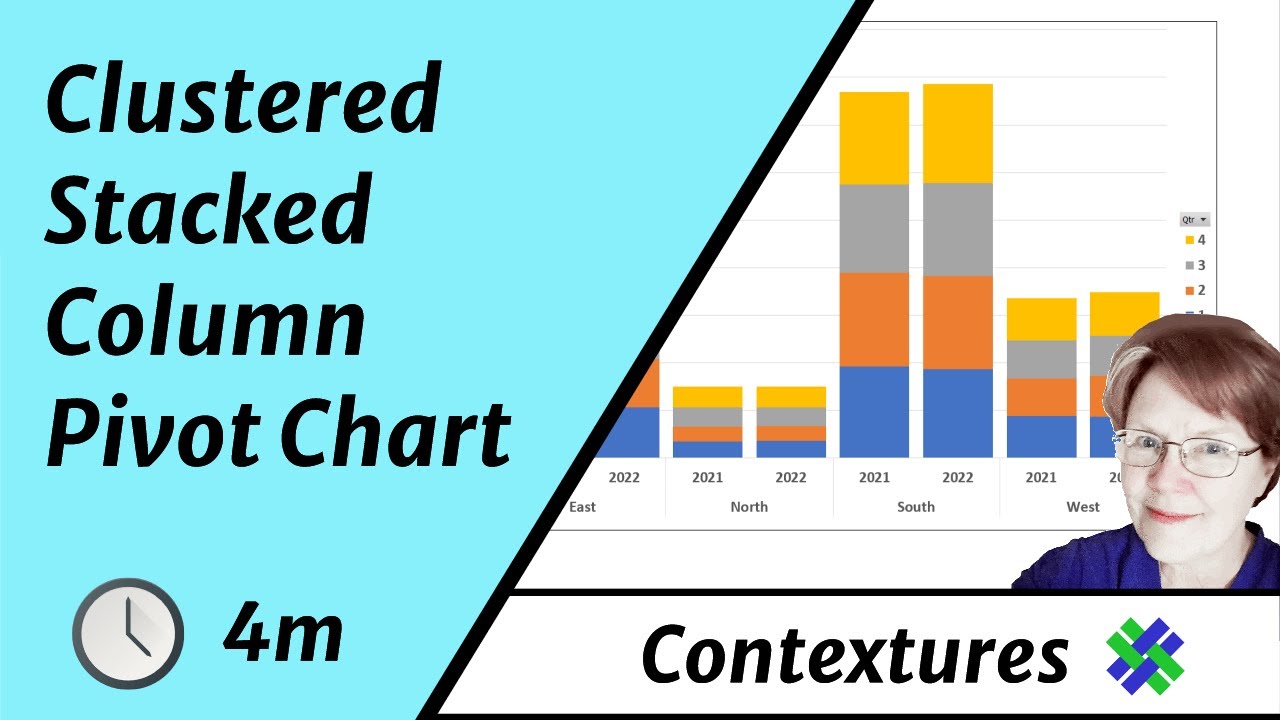
Create a Clustered Stacked Column Pivot Chart in Excel
Показать описание
Excel doesn't have a Cluster Stack chart type, but you can make a pivot chart with stacked columns that are grouped into "clusters".
Watch this video to see how to set up a pivot table, based on an Excel table with quarterly sales data.
Next, create a pivot chart, with region and year in the horizontal axis, and a stacked column for each year.
Get the sample file from my Contextures website:
Video Timeline
0:18 Excel Table
0:41 Make a Pivot Table
2:33 Add a Pivot Chart
3:04 Format the Chart
Instructor: Debra Dalgleish, Contextures Inc.
 0:03:28
Make a Clustered Stacked Chart in Excel
 0:02:15
How to create a Clustered Stacked Column Chart in Excel
 0:17:28
How To Create A Clustered Stacked Column Chart In Excel
 0:11:05
Excel Column Chart - Stacked and Clustered combination graph
 0:09:24
019. How to create a Clustered Stacked Column Chart in Excel
 0:05:27
Excel Visualization | How To Combine Clustered and Stacked Bar Charts
 0:13:51
Combination Stacked & Clustered Column Chart in Excel - 2 Examples
 0:08:09
Clustered Stacked Bar Chart In Excel
 0:08:59
How-to Easily Create a Clustered Stacked Column Chart in Excel
 0:03:54
Create a Clustered Stacked Column Pivot Chart in Excel
 0:08:29
Clustered Stacked Bar Chart In Excel | How to create a Clustered Stacked Column Chart in Excel
 0:03:18
Combine stacked and clustered bar chart in Excel
 0:17:18
How To Create A Clustered Stacked Column Chart In Excel
 0:09:23
How To Create A Clustered Stacked Bar Chart In Excel
 0:08:29
How to create a Clustered Stacked Column Chart in Excel
 0:10:15
Stacked, clustered and 100% chart (think-cell tutorials)
 0:07:01
How-to Create a Stacked and Unstacked Column Chart in Excel
 0:09:17
How to Make a Clustered Stacked and Multiple Unstacked Chart in Excel
 0:04:09
How-to Make an Excel Clustered Stacked Column Chart with Different Colors by Stack
 0:07:42
Power BI Clustered and Stacked Column Chart
 0:11:12
How to Make a Clustered Stacked and Multiple Unstacked Chart in Excel 2019
 0:07:08
How To Create a CLUSTERED COLUMN Chart in EXCEL - Step By Step
 0:05:49
Powerpoint & Excel: Creating a Stacked Clustered Column/Bar Chart
 0:05:58
How to Create a Clustered Bar Graph With Multiple Data Points on Excel
Комментарии