filmov
tv
If ocean levels are rising, why can't we see it?

Показать описание
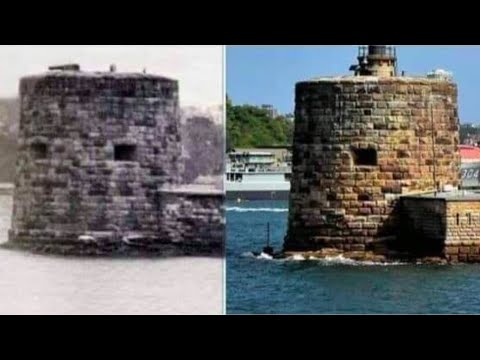
Compare two photos 130 years apart and it looks as though sea levels haven't moved. In fact, they have. This video closes the gap between photos and actual measurement.
In answer to several questions about why sea level rises at different rates in different parts of the world, it is a complex mix of ocean currents, gravitational pull, atmospheric pressure, Earth's rotation, regional changes in ocean temperature and other factors.
See:
See also: NPR interview, Christopher Piecuch, climate scientist at Woods Hole Oceanographic Institute, discussing "Why Sea Level Rise Varies Across The World"
CORRECTIONS:
1) The shades of blue on the map at 10:58 denote sea level falling, not rising at the lowest rate..
2) I said glaciers cover around 10% or the Earth -- I should have said 10% of the land surface of the Earth.
3) Two posters pointed out that Reiss's question to Hansen could be taken to mean 'What would the view be like in 40 years' time if CO2 concentration was NOW double?" In other words, Hansen was predicting sea level 40 years AFTER a doubling of CO2."
To be fair to Hansen, that's possible. If so, his prediction will very likely be correct.
But it again stresses the need to have these predictions made in peer-reviewed scientific journals, where such ambiguity is eliminated, rather than books.
TO SUPPORT THE CHARITY AND KEEP MY CHANNEL GOING....
You can see more on how this groundbreaking charity trades heath care for forest care in my video
SOURCES:
255 billion tonnes ice lost per year:
"Return to rapid ice loss in Greenland and recordloss in 2019 detected by the GRACE-FO satellites" Sasgen et al 2019
Sea level rise up to 2008:
"More than half of the predicted rise in future sea level caused by the enhanced greenhouse effect is currently thought to be due to the thermal expansion of the oceans.”
"Thermal expansion in ocean and coupled general circulation models"
Jacket et al. 2000
"Improved estimates of upper-ocean warming and multi-decadal sea level rise"
Domingues et al 2008
Rise now 3.6mm a year:
“A 20th century acceleration in global sea-level rise”
-- Church and White, Geophysical Research letters, jan 2006
How sea level is measured:
Calculations for thermosteric and ice-melt sea level rise:
"Future sea level rise constrained by observations and long-term commitment"
Mengel et al.
"Transient response of the MOC and climate to potential melting of the Greenland Ice Sheet in the 21st century"
Hu et al 2009
"Sea-level rise due to polar ice-sheet mass loss during past 695 warm periods."
Dutton et al 2015
" Evidence of marine ice-cliff instability in Pine Island Bay from iceberg-keel plough marks"
Wise 2017 Nature Communications
"Coralgal reef morphology records punctuated sea-level rise during the last deglaciation"
Khanna 2017
5-19m higher for +3 deg C rise in temp:
"Constraints on global mean sea level during Pleistocene warmth."
Dimitriu, 2019
See also: "The Duplin Formation... was 35 ± 18 m above present."
Dowset and Cronin, cited in "Paleo Constraints on Future Sea-Level Rise"
Kemp 2015
"We project anthropogenic sea level rise of 28–56 cm, 37–77 cm, and 57–131cm cm in
2100 for the greenhouse gas concentration scenarios RCP26, RCP45, and RCP85" RCP45"
"Future sea level rise constrained by observations and long-term commitment"
Mengel et al., 2016
E-mail from Bob Reiss:
Post from James Hansen:
Sea level at time of CO2 doubling:
I couldn't find any studies looking specifically at sea level when CO2 doubles in concentration. So I had to match predictions for when CO2 will double under RCP 4.5 (around 2065) with projections for sea level rise under RCP 4.5 at that time.
 0:29:08
If ocean levels are rising, why can't we see it?
 0:05:17
【Map】Sea Level Rise Simulation - Europe
 0:02:45
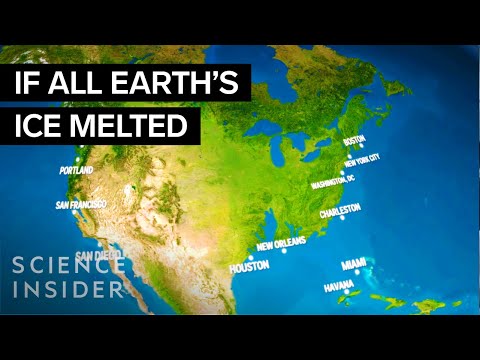
How Earth Would Look If All The Ice Melted | Science Insider
![[4k]Sea Level Rise](https://i.ytimg.com/vi/q87mUl13s-s/hqdefault.jpg) 0:08:08
0:08:08
[4k]Sea Level Rise and Fall Simulation - World
 0:11:24
How Our Coastlines Will Change
 0:06:26
What if the Ocean DISAPPEARED?
 0:22:30
Nothing To Sea Here Folks
 0:00:32
Trump: Sea-level Rise Just Means 'A Little More Beachfront Property'
 0:06:24
Greenland Unveiled: Secrets, Myths, and the Global Significance of the World's Largest Island
 0:00:28
Global Sea Levels Are Rising #Shortsfeed #shortvideoviral #shortvideo #feedsshort #viralshorts
 0:27:20
15 Places We Will Lose to Rising Sea Levels
 0:00:19
Earth's sea-level keeps on rising. #climatechange #sea #ocean #earth #globalwarming #environme...
 0:00:41
Sea Level Rise (1993-2022)
 0:06:55
What If Sea Levels Suddenly Rose 500 Meters?
 0:01:39
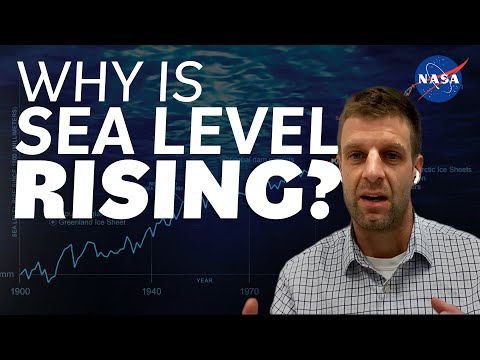
Why is Sea Level Rising? We Asked a NASA Scientist
 0:08:52
What Happens if Sea Levels Drop by 1000 Metres?
 0:01:00
Have sea levels remained stable over the past century? | DW News
 0:06:34
How Will Earth Change If All the Ice Melts?
 0:00:25
Scientists Have Found A Way To Stop Rising Sea Levels #Shorts
 0:01:16
The Truth About Rising Sea Levels
 0:11:00
If Antarctica Melts, Who Actually Survives?
 0:06:09
Sea level rise is so much more than melting ice
 0:09:29
Shouldn't sea levels have risen by now?
 0:04:14
Why Are Sea Levels Rising at Different Rates? | Ars Technica
Комментарии