filmov
tv
Boxplots in Statistics | Statistics Tutorial | MarinStatsLectures

Показать описание
This statistics video tutorial presents the boxplots and all of the useful info they convey. A boxplot is a commonly seen plot, and conveys a lot of information in a single plot. You have likely seen these plots in many papers. They are useful for describing the distribution of a numeric variable, as well as indicating a few key points, such as the median and quartiles. They are also useful in identifying outliers. While an outlier should not just be removed from a dataset without just cause, it can be helpful in identifying these observations for further examination, or at least for understanding where they are. Later, we will discuss the effect outliers can have on summary measures such as the mean and standard deviation.
►► Watch More:
Follow MarinStatsLectures
Our Team:
Content Creator: Mike Marin (B.Sc., MSc.) Senior Instructor at UBC.
Producer and Creative Manager: Ladan Hamadani (B.Sc., BA., MPH)
These videos are created by #marinstatslectures to support some statistics courses at the University of British Columbia (UBC) (#IntroductoryStatistics and #RVideoTutorials ), although we make all videos available to the everyone everywhere for free.
Thanks for watching! Have fun and remember that statistics is almost as beautiful as a unicorn!
#statistics #rprogramming
 0:06:39
Box-Plot (Simply explained and create online)
 0:08:05
Boxplots in Statistics | Statistics Tutorial | MarinStatsLectures
 0:02:33
Boxplots are Awesome!!!
 0:13:56
How To Make Box and Whisker Plots
 0:03:18
Box and whisker plot | Descriptive statistics | Probability and Statistics | Khan Academy
 0:03:24
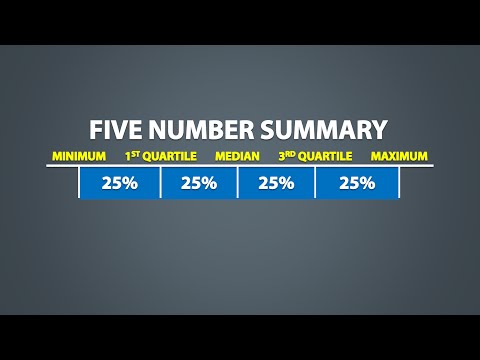
Five Number Summary, Boxplots, and Outliers | Statistics Exercises
 0:10:22
Skewness - Right, Left & Symmetric Distribution - Mean, Median, & Mode With Boxplots - Stati...
 0:03:14
Another example constructing box plot | Data and statistics | 6th grade | Khan Academy
 0:05:24
Statistical Machine Learning Assignment Presentation
 0:04:58
Understanding & Comparing Boxplots (Box and Whisker Plots)
 0:05:37
The Five Number Summary, Boxplots, and Outliers (1.6)
 0:18:06
Box-Plots with Statistical Details - all you need to know
 0:11:53
Box Plot - 1 | How to draw Box Plot and Outlier | Data Mining | Statistics
 0:07:43
Interpreting box plots | Data and statistics | 6th grade | Khan Academy
 0:19:55
Understand Box Plots in Statistics (Box-and-Whisker Plots) - [6-8-23]
 0:04:46
Statistics Grade 10: Box and whisker
 0:05:25
Comparing dot plots, histograms, and box plots | Data and statistics | 6th grade | Khan Academy
 0:06:53
A-Level Maths: L1-02 [Data: Box Plots / Box and Whisker Diagrams]
 0:06:12
Statistics - How to make a box and whisker plot
 0:08:18
Constructing a box and whisker plot | Probability and Statistics | Khan Academy
 0:04:15
Boxplots and Grouped Boxplots in R | R Tutorial 2.2 | MarinStatsLectures
 0:03:44
Finding Outliers & Modified Boxplots 1.5(IQR) Rule
 0:03:27
Box and Whisker Plots | MathHelp.com
 0:08:01
How To Create A Box Plot In Excel (Including Outliers)
Комментарии