filmov
tv
How to Graph Marginal Distribution from Two-Way Table | Statistics Exercises
Показать описание
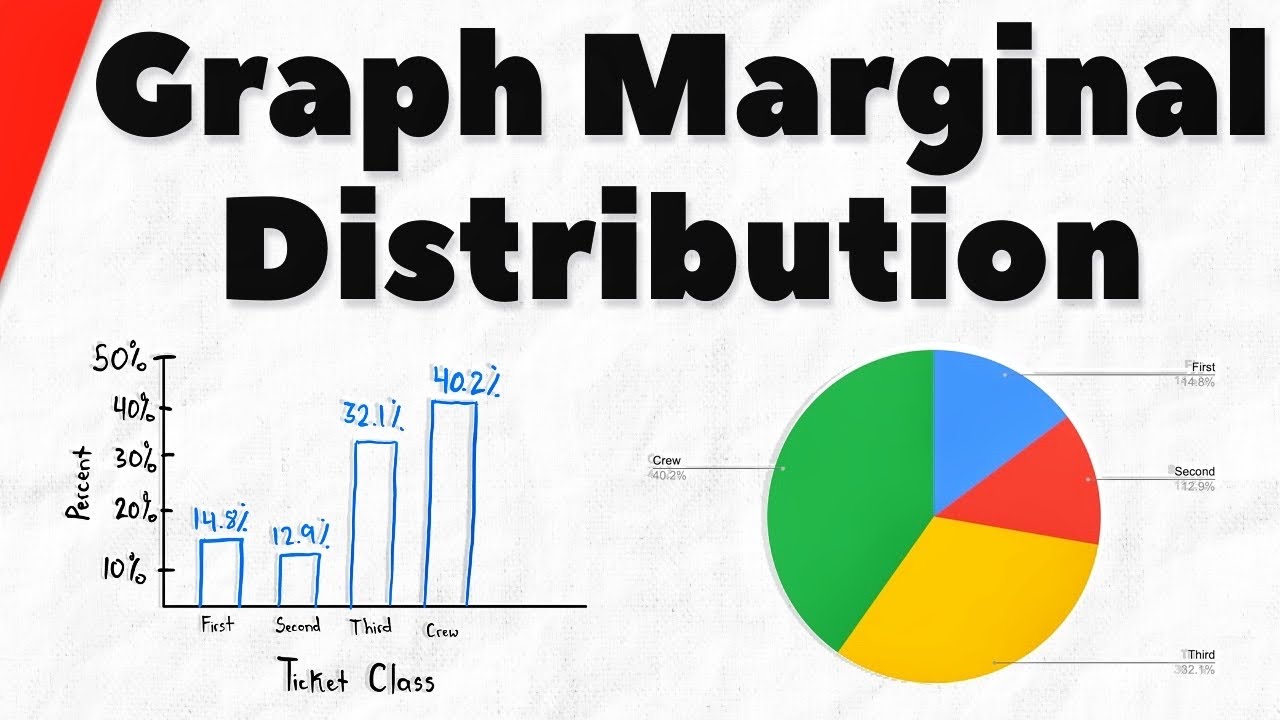
We go over how to use a two way table to graph a marginal distribution using a bar chart for a categorical variable. In the margins of the two-way table (also called a contingency table) we see the distributions of individual categorical variables. From this info we can make a relative frequency table and then use these percents to make a bar chart. We'll do this for the ticket class of those aboard the Titanic. #statistics #apstats
Join Wrath of Math to get exclusive videos, lecture notes, and more:
★DONATE★
Outro music by Ben Watts and is available for channel members.
Follow Wrath of Math on...
0:00 Intro
1:21 Calculating Marginal Distribution
2:08 Bar Chart for Marginal Distribution
4:22 Pie Chart for Marginal Distribution
4:37 Conclusion
 0:04:49
 0:06:36
 0:10:06
 0:06:35
 0:01:32
 0:03:47
 0:03:25
 0:05:43
 0:02:49
 0:13:49
 0:11:43
 0:09:18
 0:02:18
 0:08:16
 0:09:52
 0:05:17
 0:20:40
 0:08:54
 0:04:13
![[Chapter 6] #4](https://i.ytimg.com/vi/Ty64JsNlcnk/hqdefault.jpg) 0:31:15
0:31:15
 0:10:30
 0:21:45
 0:08:21
 0:15:13